News from LabRulezICPMS Library - Week 33, 2026

LabRulez / AI: News from LabRulezICPMS Library - Week 33, 2026
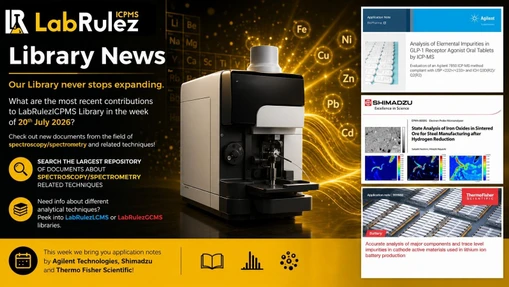
Our Library never stops expanding. What are the most recent contributions to LabRulezICPMS Library in the week of 10th August 2026? Check out new documents from the field of spectroscopy/spectrometry and related techniques!
👉 SEARCH THE LARGEST REPOSITORY OF DOCUMENTS ABOUT SPECTROSCOPY/SPECTROMETRY RELATED TECHNIQUES
👉 Need info about different analytical techniques? Peek into LabRulezLCMS or LabRulezGCMS libraries.
This week we bring you application notes by Agilent Technologies, Shimadzu and Thermo Fisher Scientific!
1. Agilent Technologies: Accurate and Robust Measurement of Elemental Impurities in Pharmaceuticals by ICP-MS
Implementation of Indian Pharmacopeia General Chapter 5.10 compliant workflow using the Agilent 7850 ICP-MS
- Application note
- Full PDF for download
Elemental impurity testing is a vital part of pharmaceutical quality assurance because trace metals can enter drug products at various points of the manufacturing process. Impurities may originate from raw materials and excipients, leach from processing equipment, remain as residues from catalysts, or arise through environmental or packaging related contamination. Even at very low concentrations, certain metals pose toxicological risks, making their assessment and control essential for ensuring product safety.
To address these risks, global regulatory bodies—including the U.S. Food and Drug Administration (FDA), the European Medicines Agency (EMA), and other members of the International Council for Harmonization (ICH)—require manufacturers to perform systematic risk assessments and ongoing monitoring of elemental impurities. The harmonized ICH Q3D guideline provides the framework for this evaluation by defining toxicology based permitted daily exposure (PDE) limits. It also outlines expectations for analytical testing, reporting, and control strategies across a variety of dosage forms.
To align with these international regulatory standards, the draft Indian Pharmacopeia (IP) General Chapter 5.10 has been developed to harmonize with the corresponding requirements of the European, Japanese, and U.S. Pharmacopeias.6 Harmonization will ensure that India’s regulatory framework reflects globally accepted best practices for assessing and controlling elemental impurities. It will also ensure that pharmaceutical products manufactured for the Indian and global markets meet internationally aligned safety standards. As part of these harmonized expectations, IP General Chapter 5.10 mandates the quantitative determination of specified elemental impurities using validated, high performance analytical technologies such as ICP MS or ICP OES. These techniques provide the sensitivity, selectivity, and sample throughput required to reliably measure trace-level elemental impurities and demonstrate compliance with PDE based limits.
An Agilent 7850 ICP-MS was used in this study to meet the trace level elemental impurity requirements defined in IP General Chapter 5.10. Designed to quantify elements at low concentrations, the 7850 achieves detection limits suitable for accurate, confident measurement of impurities at sub ppb levels. Its advanced ORS4 collision cell technology uses helium (He) mode to effectively remove polyatomic interferences across multiple analytes, enabling reliable measurement of secondary or qualifier isotopes. This capability supports analyte confirmation as required by regulatory guidelines, including IP 5.10, ICH Q2(R1), USP <233>, and USP <1225>. The combination of sensitivity and spectral clarity is essential when testing regulated pharmaceutical products, where accuracy, reproducibility, and compliance with pharmacopeial limits are required.
The 7850 ICP-MS delivers robust performance in real-world pharmaceutical environments, where complex matrices and routine, high throughput testing are the norm. The hightemperature plasma improves matrix tolerance, minimizes matrix-induced interferences, and enhances ionization efficiency.8 This capability provides higher and more consistent sensitivity for poorly ionized elements such as As, Cd, and Hg, as well as platinum group elements (PGEs) including Os, Ir, and Pt. T
he 7850 ICP-MS system’s high matrix tolerance also enables efficient handling of diverse sample types, including active pharmaceutical ingredients (APIs), excipients, and finished dosage forms, without excessive dilution or instrument downtime. Long term signal stability ensures consistent results throughout long analytical runs, minimizing re-analysis and supporting dependable quality control (QC) testing.
The 7850 offers streamlined, workflow-based operation with intuitive software and pre-configured method templates that are aligned with pharmacopeial guidelines. Instrument parameters are automatically optimized, simplifying method development, minimizing operator intervention, and ensuring consistent analytical performance.
This application note outlines an end-to-end analytical workflow designed to help laboratories comply with the elemental impurity requirements of IP General Chapter 5.10 using ICP MS. Twenty four elements were determined in three types of oral drug products, and the method was evaluated against the performance criteria specified in IP 5.10.
Conclusion
The analytical approach described in draft Indian Pharmacopoeia (IP) General Chapter 5.10 for the determination of elemental impurities in pharmaceutical products was applied in this study using ICP-MS. Three over-the-counter oral tablet drugs were acid digested by microwave, spiked at various J levels, and analyzed for 24 target elements using an Agilent 7850 ICP-MS.
The 7850 ICP-MS, equipped with a robust plasma system and the ORS4 collision/reaction cell operating in helium mode, effectively minimized polyatomic interferences and enabled accurate measurement of target isotopes and qualifier ions. Its wide dynamic range detector further supported the analysis of all three oral drug products using a single analytical method and standard operating conditions.
Instrument setup and method development were simplified by selecting General Purpose plasma conditions, applying automated lens tuning, and using the ICH/USP preset method in the Agilent ICP-MS MassHunter software.
The method met all performance criteria outlined in IP 5.10, including specificity, accuracy, spike recovery, stability, and system suitability for both limit and quantitative procedures. Instrument detection limits were significantly lower than the J values for oral drugs, ensuring reliable quantification of elemental impurities at regulatory control levels.
Overall, the results confirm that the 7850 ICP-MS provides a reliable, sensitive, and efficient platform for compliance with IP 5.10 requirements for elemental impurity testing in oral drug products. The simplified method development, robust interference removal, and workflow-based operation significantly reduce analytical complexity while supporting consistent regulatory compliance for routine pharmaceutical quality control laboratories.
2. Shimadzu: Evaluation of Particle Size in Chocolate —Evaluation of Particle Size Distribution and Coarse Particles that Affect Texture
- Application note
- Full PDF for download
User benefits
- The solid particle size distribution in chocolate can be easily measured using the SALD-2300.
- The iSpect DIA-10 enables not only the measurement of particle size distribution but also, the number concentration of particles in a specified particle size range.
Particle size distribution is one of the physical properties that describe the characteristics of materials and products containing particulate matter. In some cases, the difference in characteristics can be described simply by the average particle size. In other cases, the amount of particles above a certain size is important. The values to be noted vary depending on the type of material, product, and its intended use.
Here, chocolate is taken as an example of a product where particle size control is important. An example is presented of measuring the particle size distribution and the quantity of particles within a specific size range to assess the texture of chocolate.
When performing chocolate quality control, the particle size distribution is generally evaluated using a laser diffraction-type particle size distribution analyzer. In this article, in addition to using the SALD-2300 Laser Diffraction Particle Size Analyzer, the iSpect DIA-10 Dynamic Particle Image Analysis System is also employed to show the possibility of a slightly different evaluation approach to investigating the relationship between particle size/concentration and texture.
Measurement of Particle Size Distribution by SALD-2300
Chocolate is solid at room temperature. Therefore, it must be dissolved (dispersed) in a solvent to measure the particle size distribution of the solid particles contained within it. Samples must also be diluted to a concentration suitable for the particle size distribution measuring analyzer. Isopropanol was selected as the dispersant because it can dissolve oil and fat and disperse the solid particles to measure the particle size distribution of just the solid particles in the chocolate.
Two commercial milk chocolate samples were used: sample F and sample UF. Taste tests were conducted by several individuals (including the author), and comparisons were made prior to measurement. The taste tests focused on texture differences and the smoothness on the palate and tongue. The results showed that although there were differences among individuals, most perceived sample UF as smoother than sample F, while sample F feltslightly rough.
Particle Size and Number Concentration Measurement by iSpect DIA-10
So far, the particle size distribution of two types of chocolate has been measured using the SALD-2300, and the relationship between the results and the texture has been examined. Next, we considered the measurement results obtained using the iSpect DIA-10.
The iSpect DIA-10 is different from general image analysis type particle size measurement equipment, and it has the advantage of being able to detect almost all particles within the measurement range. As a result, it is possible to accurately calculate the number concentration in the measurement solution.
From the SALD-2300 measurement results, it is clear that the sample contains about 20 to 30 percent particles that are below 5 µm, which is the minimum measurement size of iSpect DIA-10. Therefore, it is not possible to capture the number concentration of all particlesin the sample.
On the other hand, since no particles exceed the measurement limit of 100 µm and almost all particles in the coarse particle region can be detected, it is possible to calculate the number concentration of particles above a certain size.
The results of measurements of samples F and UF using the iSpect DIA-10 are presented below. The dispersion procedure is the same as that for the SALD-2300 shown in Table 1, but the final concentration is equivalent to that of 0.1 g of chocolate dispersed in 1000 mL of isopropanol due to a further 50 times dilution during measurement.
Conclusion
In this article, the particle size distribution of chocolate was measured using two instruments, the SALD-2300 and the iSpect DIA-10, and introduced the relationship between these results and the texture perceived when the chocolate was eaten. By looking at the results of the two measurement methods together, it is believed that a more in-depth analysis is possible.
In particular, the results of the number concentration of coarse particles measured using the iSpect DIA-10 are considered useful for evaluating texture based on the quantity of coarse particles. This can be expected to be effective in the food field and other fields where the abundance of small quantities of coarse particlesisimportant.
3. Thermo Fisher Scientific: From waste to performance: Reactive extrusion upcycling validated by rheology and chemical (FTIR) imaging
- Application note
- Full PDF for download
Global plastic production exceeds 400 million tons annually, with polypropylene among the most widely used polymers. This high volume of polymer production results in large amounts of plastic ending up in our environment. Recycling is a strong potential solution; however, mechanical recycling often leads to molecular weight degradation via chain scission, limiting performance in secondary applications.
Upcycling through reactive extrusion provides a pathway to restore or enhance performance by incorporating recycled streams into high-value matrices. Polyamide 12 (PA12) offers superior mechanical and thermal properties but is immiscible with polypropylene due to thermodynamic incompatibility.
Compatibilization using PP-g-MA enables interfacial stabilization through in situ formation of diblock copolymers via reaction between maleic anhydride groups and PA12 amine end groups. This study evaluates several aspects of the resultant plastic products:
- Molecular degradation of reprocessed PP
- Rheological signatures of interfacial stabilization
- Mechanical property recovery
- Quantitative chemical homogeneity via FTIR mapping
Materials and methods
Specimens were molded using the HAAKE MiniJet Pro Piston injection molding system:
- 25 mm disc specimens for rheology
- Dog-bone specimens for tensile testing
Rheological characterization was performed using oscillatory rheology. A HAAKE MARS iQ rotational rheometer was employed, measure key features.
- Parallel plate geometry
- Amplitude sweep (LVR determination)
- Frequency sweep (viscoelastic response)
FTIR microscopy and chemical mapping
While rheological and mechanical testing provide indirect evidence of interfacial stabilization, direct chemical verification of phase distribution is required to confirm compatibilization efficiency. Immiscible polymer blends such as PP/PA12 exhibit morphology-dependent performance governed by droplet size, spatial distribution, and interfacial adhesion.
Micro-ATR Fourier transform infrared (FTIR) spectroscopy enables spatially resolved chemical analysis without extensive sample preparation. The Nicolet RaptIR+ FTIR microscope was used to collect high-density chemical maps of blend cross-sections, providing direct insight into compositional uniformity and interfacial mixing.
ATR sampling was selected to minimize preparation artifacts and avoid the need for thin microtomed sections. The evanescent wave penetration depth of less than a few microns enables surface-sensitive chemical characterization while maintaining high spectral quality.
To enable quantitative phase mapping, distinct and non-overlapping spectral markers were selected:
- PA12 amide I band (~1636 cm⁻¹) – characteristic carbonyl stretch of polyamide
- PP methyl deformation (~1376 cm⁻¹) – characteristic polypropylene signature
These bands were chosen for specific reasons:
- High intensity
- Minimal overlap
- Structural specificity
Conclusion
Reactive extrusion of reprocessed polypropylene with PA12 using PP-g-MA successfully produced a mechanically robust upcycled material containing 50% recycled content.
Key outcomes:
- Rheology confirmed enhanced interfacial stability.
- Tensile properties were restored to near-virgin PA12 performance.
- FTIR chemical mapping provided quantitative compositional uniformity analysis.
- Statistical treatment of mapping data enabled objective evaluation of compatibilization efficiency.
The integrated workflow combining extrusion, molding, rheology, and FTIR microscopy enables accelerated development of sustainable polymer blends with validated performance.