Understanding PT statistics
Eurachem: Understanding PT statistics
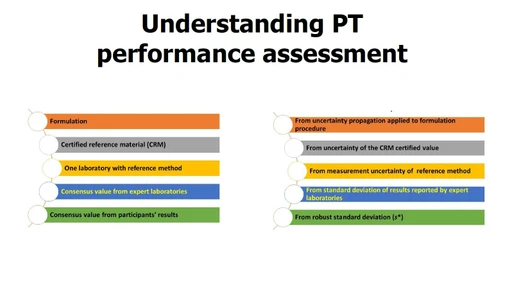
The Eurachem Guide on “Selection, Use and Interpretation of Proficiency Testing (PT) Schemes” [1] recommends participants to consider the statistical approach used by the PT provider when selecting a PT scheme. This leaflet is intended to help participants in quantitative PT schemes to better understand the statistical parameters that describe the data distribution in the PT report. The PT report should also provide information on how the assigned value (xpt), the corresponding uncertainty (u (xpt)) and the standard deviation for proficiency assessment (σpt) were obtained [2].
Summary statistics reported in PT schemes typically describe two features of a data set or of an underlying normal distribution of technically valid results. One feature is the location, usually described by some kind of average. The second is the dispersion, or spread of the data. A further important summary statistic is the (standard) uncertainty associated with the location, which can help to determine whether the chosen location estimator differs from (for example) an external reference value or from individual reported results. The different statistics used for these purposes are summarised below.
Location of the results reported by participants
An estimated location is usually reported even if it is not used as the assigned value. ISO 13528 [3] describes different ways to estimate the location using the arithmetic mean or median, or applying sophisticated robust statistical methods (Table 1).
Key points to note:
- When data sets contain outliers or when symmetry of the data set cannot be verified, ISO 13528 strongly recommends to use robust estimators.
- When using the arithmetic mean, the PT provider would normally have checked the data set and removed any outliers.
- All estimates of location can be unreliable for data sets with a small number of results.
- A significant difference between the estimated location and a reference value may indicate a bias of the analytical methods (maybe just one, some or for all methods) that have been used by the participants.
- If the participants used different analytical methods, the PT provider might report different estimated locations for each of these methods.
Dispersion of results reported by participants
The standard deviation is an estimate of dispersion of a data set. There are various possibilities to estimate the despersion of data including MADe, nIQR, Algorithm A, Qn or Q method (Table 1). Often, they are normalised to allow direct comparability to the standard deviation of a normally distributed data set.
Key points to note:
- The dispersion is expressed in the same units as the measurand or reported as a percentage.
- When estimating the classical standard deviation, the PT provider would normally have checked the data set and removed any outliers.
- All estimates of dispersion can be unreliable for data sets with a small number of results.
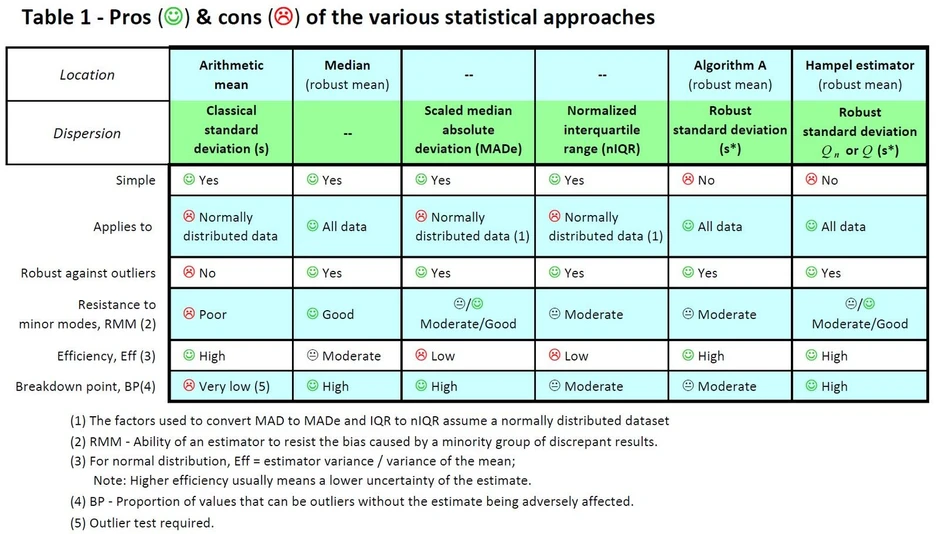 Eurachem: Table 1 - Pros & cons of the various statistical approaches
Standard uncertainty of the location
The standard uncertainty of the location is a measure of the reliability of the mean that can be important for participants.
Key points to note:
- The standard uncertainty of the arithmetic mean is calculated as:
-
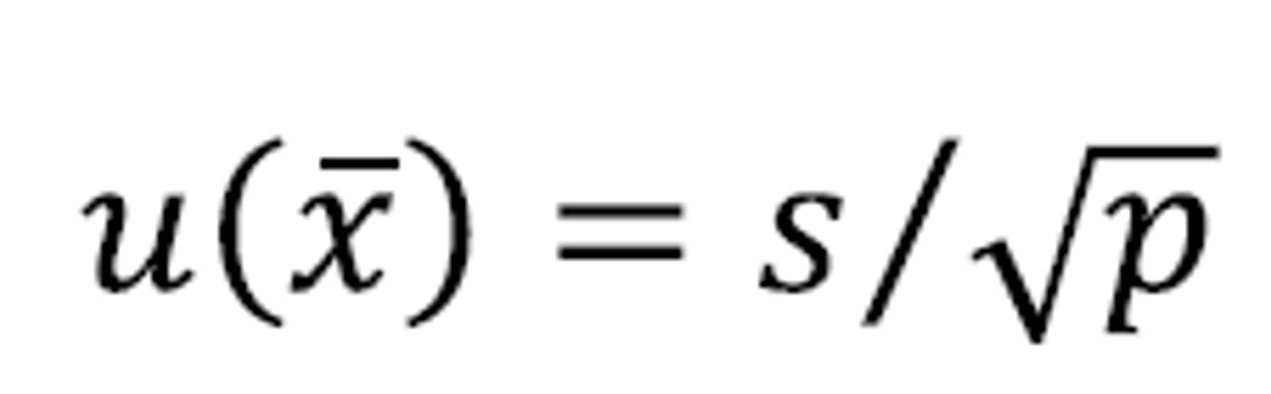
- where s is the classical standard deviation, and p the number of reported results.
-
- For other estimators of the mean ISO 13528 suggests to use an additional (conservative) multiplication factor set to 1.25, hence:
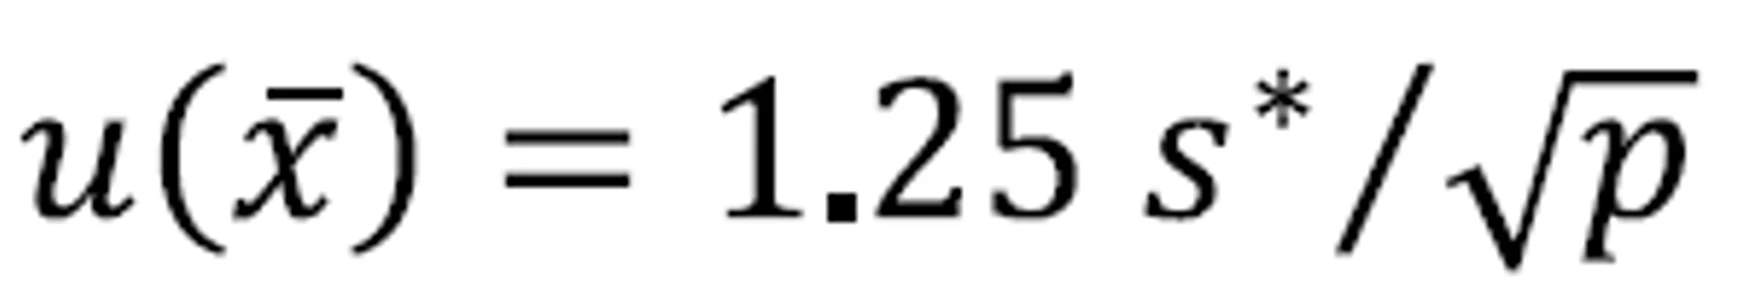
- where s* is the robust standard deviation from MADe, nIQR, Algorithm A, Qn or Q method, and p the number of reported results.
[1] B. Brookman and I. Mann (eds.) Eurachem Guide: Selection, Use and Interpretation of Proficiency Testing (PT) Schemes (3rd ed. 2021). Available from www.eurachem.org.
[2] Eurachem leaflet “Understanding PT performance assessment”. Available from www.eurachem.org.
[3] ISO 13528:2022 - Statistical methods for use in proficiency testing by interlaboratory comparison.