Understanding PT performance assessment
Eurachem: Understanding PT performance assessment
This leaflet is intended to help participants in quantitative proficiency testing (PT) schemes to better understand the performance assessment made by the PT provider [1-4].
Performance assessment parameters
Assigned value
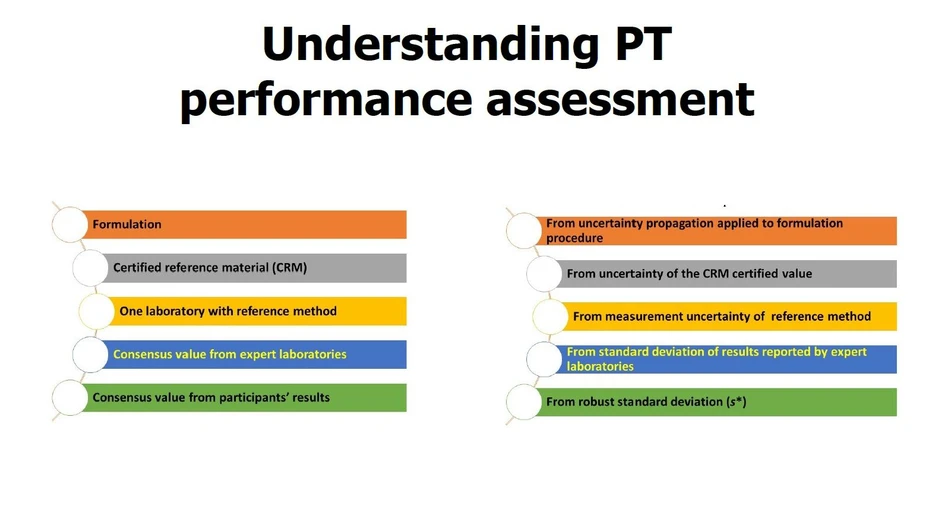
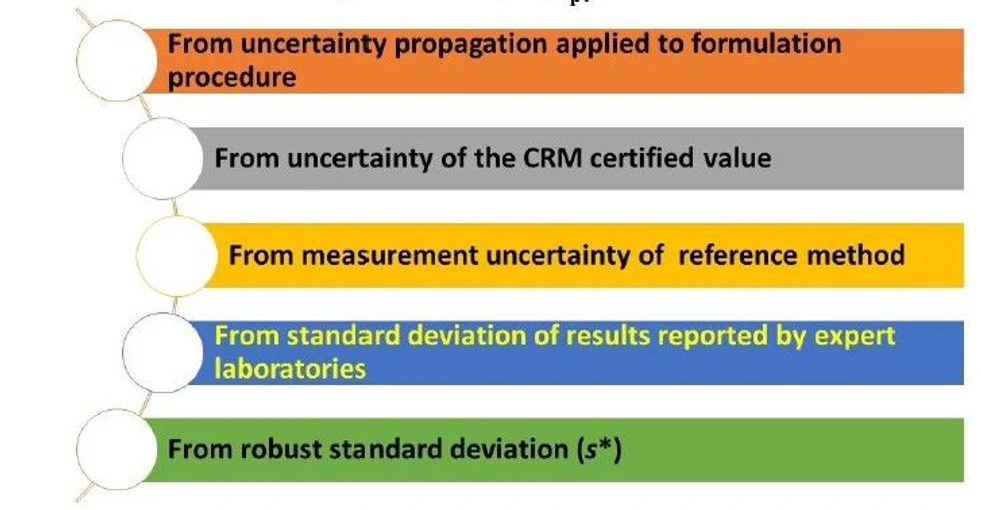
In order to assess individual performances, the results reported by participants are compared to the value assigned by the PT provider (xpt). ISO 13528 [1] suggests five different ways to obtain xpt (Figure 1). In this context, the design of the PT scheme must reflect the objectives of the scheme, comparing results either to a predetermined xpt (independent from the participant results), or to a value derived from the reported results. The PT provider is responsible for defining xpt , taking into account the advantages and disadvantages of the various possibilities when establishing metrological traceability or estimating the uncertainty of the assigned value, u(xpt).
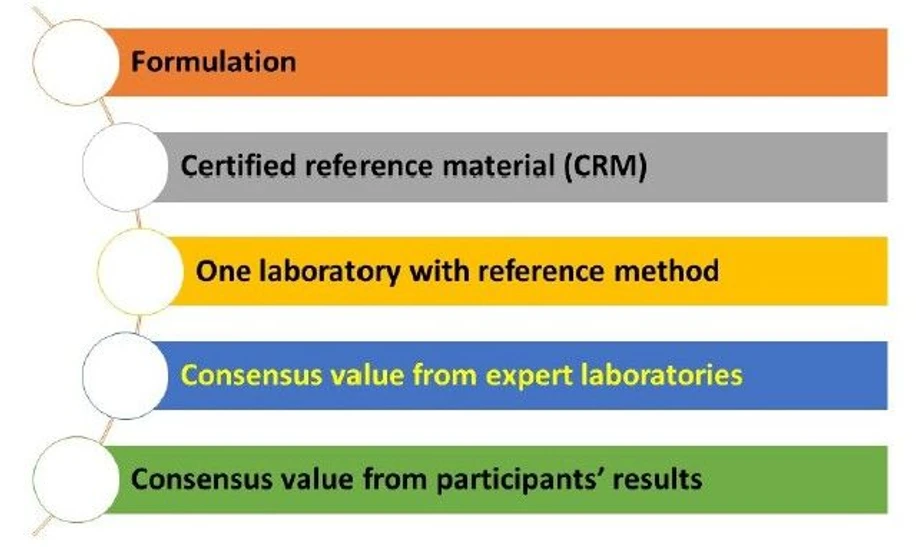 Eurachem - Figure 1 Options for obtaining the assigned value, Xpt
Uncertainty of the assigned value
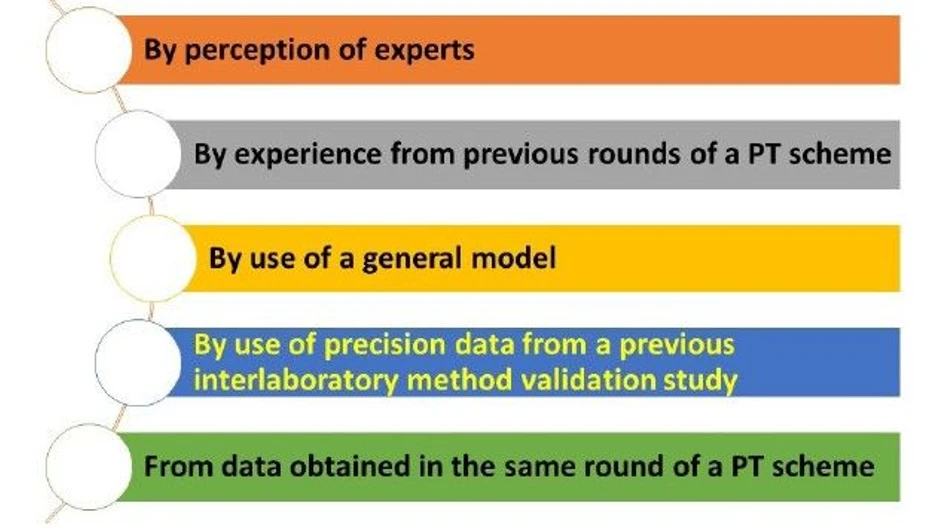
The uncertainty of the assigned value u(xpt) can be estimated in at least five different ways [1], each corresponding to the value assignment strategy illustrated in Figure 1. The different uncertainty evaluation methods are listed in Figure 2. This uncertainty can be reported as a standard uncertainty (u (xpt)), or as an expanded uncertainty U (xpt) with a coverage factor k, where U (xpt) = k . u (xpt). The choice of k will impact the level of confidence (e.g. approximately 95 % for k = 2).
 Eurachem: Figure 2 Options for obtaining the uncertainity of the assigned value, u(Xpt)
Standard deviation for proficiency assessment
Five possibilities are suggested by ISO 13528 to set the standard deviation for proficiency assessment spt (Figure 3). The chosen approach must comply with the objectives of the PT scheme.
 Eurachem: Figure 3 Options for obtaining the standard deviation for proficiency assesment
Two approaches for performance assessments use spt as shown in Table 1.
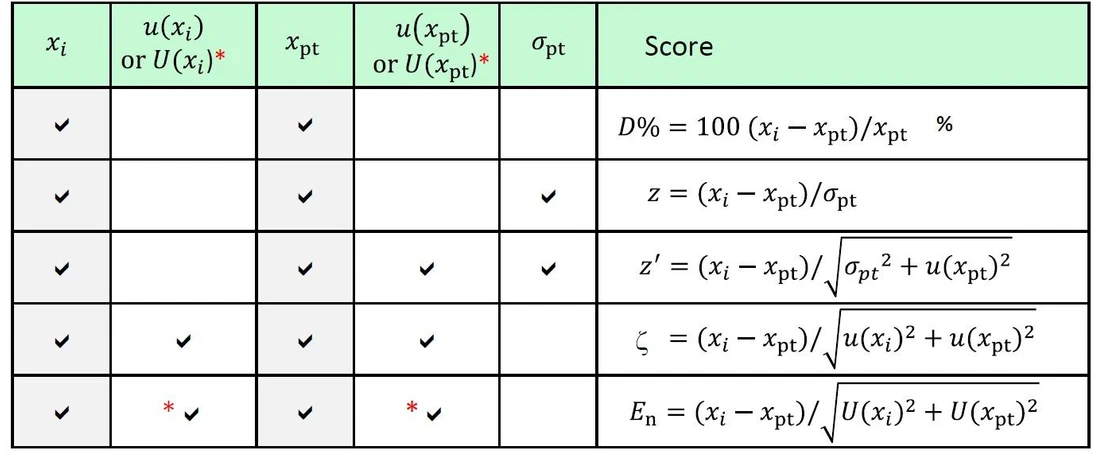 Eurachem: Table 1 - Scoring for performance assessment.
Performance assessment
All performance assessments are based on the difference between the participant’s results (xi) and the assigned value (xpt) divided by a normalisation factor (Table 1).
- The percent difference D% is the normalised difference expressed as a percentage of xpt , for which a prescribed maximum relative permissible error (dE% = dE / xpt) is defined by the PT provider.
- The z score (unitless) compares the participant’s deviation from the assigned value with the standard deviation for proficiency assessment (spt). When the uncertainty of the assigned value is significant (u(xpt) > 0.3 spt), the z’ score should be used instead, to include the contribution of u(xpt) in the denominator.
- The zeta (ζ) score (unitless) states whether the laboratory’s result agrees with the assigned value within the respective uncertainty. The denominator is the combined (standard) uncertainty of the assigned value u(xpt) and the (standard) measurement uncertainty reported by the laboratory u(xi). An unsatisfactory zeta score can either be caused by an inappropriate estimation of the measured quantity value (e.g. concentration, content), or of its measurement uncertainty, or both.
- The En score (unitless), unlike the zeta score, uses a combination of expanded uncertainties as the normalisation factor. This combination corresponds to a confidence interval of approximately 95 %. En scores are often used in metrology comparisons among calibration laboratories.
Interpretation of performance scores
According to ISO 13528:2022 clause 9.4.2, the conventional interpretation of the z, z’ and ζ scores is as follows:
- A result that gives |score| ≤ 2.0 is considered to be acceptable, indicating satisfactory performance.
- A result that gives 2.0 < |score| < 3.0 is considered to give a warning signal, indicating questionable performance.
- A result that gives |score| ≥ 3.0 is considered to be unacceptable (or action signal), indicating unsatisfactory performance.
Similarly, |En| < 1 and |D%| < dE% indicate successful (acceptable) performance.
[1] ISO 13528:2022 - Statistical methods for use in proficiency testing by interlaboratory comparison.
[2] B. Brookman and I. Mann (eds.) Eurachem Guide: Selection, Use and Interpretation of Proficiency Testing (PT) Schemes (3rd ed. 2021). Available from www.eurachem.org.
[3] Eurachem leaflet “How can proficiency testing help my laboratory”.
[4] Eurachem leaflet “Understanding PT statistics”.