Sequential versus Simultaneous Quantitative Analysis of Biomarkers in Individual Cells by ICP-MS and Mass Cytometry: A Focus on Immunotherapy
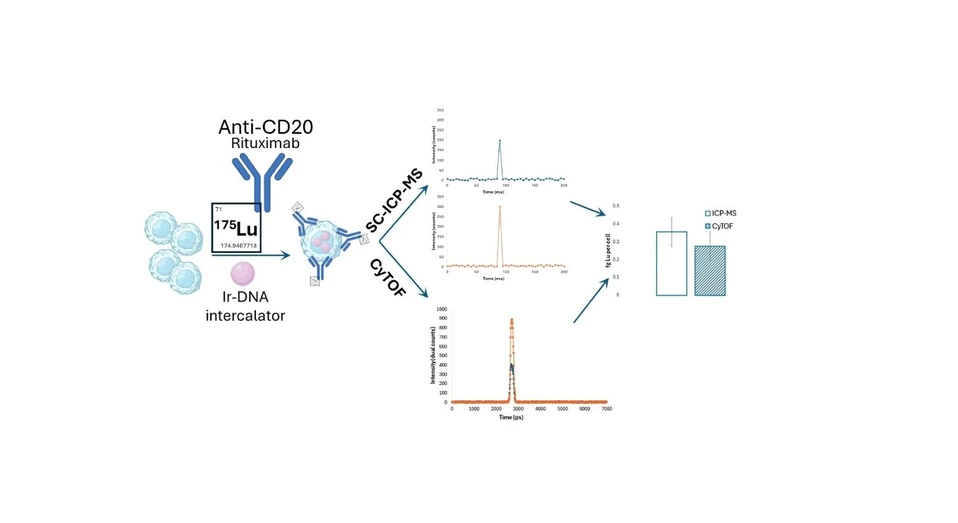
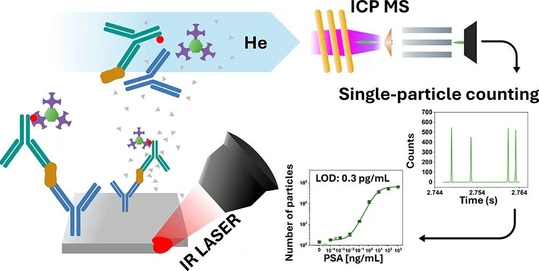
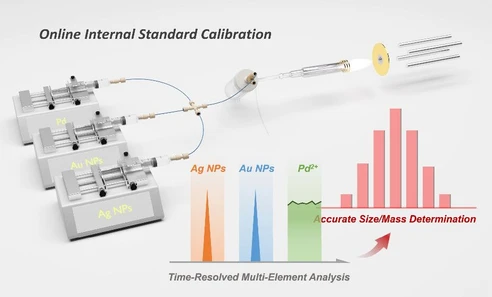
Anal. Chem. 2025, 97, 46, 25510–25518: Graphical abstract
Accurate quantification of elemental biomarkers in individual cells is essential for biological interpretation, yet is technically challenging when using nonsimultaneous mass analyzers in ICP-MS. This study evaluates the conditions under which sequential and simultaneous detection of multiple elements in single cells yields comparable quantitative results.
Endogenous elements (P and Fe) and an exogenous Ir cell marker were quantified by ICP-MS, revealing that cell storage and dilution conditions have a greater impact on accuracy than cell deposition within the sample introduction system. Under optimized conditions, CD20 expression in a B-cell chronic lymphocytic leukemia cell line (MEC-1) was quantified after labeling with Lu using both single-cell ICP-MS and mass cytometry (CyTOF). The results showed good agreement between the techniques, with CD20 levels around 1 × 10⁴ receptors per cell, consistent with literature values. Minor systematic differences were attributed to CyTOF data processing that excludes double-cell events. The study demonstrates the suitability of comparable calibration strategies for both techniques and confirms the applicability of CyTOF quantification to clinical samples.
The original article
Sequential versus Simultaneous Quantitative Analysis of Biomarkers in Individual Cells by ICP-MS and Mass Cytometry: A Focus on Immunotherapy
Ángela de la Rosa-Díaz, Christian Sordo-Bahamonde, Segundo Gonzalez, Mario Corte-Rodriguez*, and María Montes-Bayón*
Anal. Chem. 2025, 97, 46, 25510–25518
https://doi.org/10.1021/acs.analchem.5c03660
licensed under CC-BY 4.0
Selected sections from the article follow. Formats and hyperlinks were adapted from the original.
Immunotherapies represent a broad and rapidly growing group of therapies having a substantial impact on cancer outcomes. (1) Their strength relies on their potential to activate the immune system to specifically target cancer cells without the broadly damaging side effects of many conventional chemotherapeutics. Monoclonal antibodies (mAbs) were among the initial types of immunotherapy approved as anticancer treatments and continue to play a pivotal and growing role in current treatment regimens. (2) Rituximab (IDEC Pharmaceuticals, La Jolla, CA, USA), a monoclonal antibody against the cluster of differentiation 20 (CD20) antigen, was one of the first FDA-approved immunotherapeutic agents (1997) that was shown to be an effective single-agent treatment for B-cell non-Hodgkin lymphomas. (3,4) Structurally, this is an anti-CD20 chimeric antibody with human IgG1 immunoglobulin constant regions and variable regions from an anti-CD20 murine antibody. (5) CD20 is a transmembrane protein marker expressed on the surface of B-cells, as well as many B-cell malignancies, and is also believed to function as a calcium ion channel. Mechanistically, once rituximab binds to CD20-positive cells, cell death is induced by various mechanisms, including antibody-dependent cell-mediated cytotoxicity, antibody-dependent phagocytosis, complement-derived cytotoxicity, and the direct apoptotic effect of rituximab binding to CD20. (6)
However, despite its widespread use, there is still much uncertainty regarding the mechanism(s) of action of Rituximab in vivo and there is also a lack of effective predictive biomarkers to identify which patients will respond to this treatment. (7) In this regard, several studies have suggested that the level of cell surface antigen expression (e.g., CD20) may affect the response to monoclonal antibody-based therapy. (8) Thus, the development of bioanalytical methods that permit us to establish, quantitatively, the effectiveness of Rituximab binding to CD20 in patient cancer cells could help predict the therapeutic outcome of the drug before patient administration. As the concept of “personalized medicine” gains popularity, it is highly desirable to discover a prognostic indicator of response to this type of therapy and, more specifically, to identify the antibody-based regimen that is likely to be most effective in an individual patient.
With the aim to determine the relationship between levels of antigen expression and the response to monoclonal antibody therapy, the level of surface CD20 (and the clusters of differentiation 22, 25, and 52, named CD22, CD25, and CD52, respectively) expression has been previously estimated using flow cytometry. (9) In that study, the antibody binding capacity (ABC) was calculated using fluorescent beads to normalize fluorescent intensities obtained in individual cells after using saturating concentrations of the labeled antibody. However, the increasing use of mass cytometry as an alternative to flow cytometry for multiplex detection of several (up to 70) biomarkers per cell and the increasing demand for absolute values rather than comparative levels of expression of specific biomarkers in individual cells require the development of quantitative and absolute methods of analysis. (10,11) At this point, the previously developed quantitative experiments of single-cell inductively coupled plasma mass spectrometry (SC-ICP-MS) can be of extraordinary importance. (12) Among various mass spectrometric techniques, SC-ICP-MS has been proven to be a versatile tool for studies on the determination of constitutive elements, (13,14) the cellular uptake of metal-containing drugs, (15) and the incorporation of metallic nanoparticles in individual cells. (16,17) In combination with labeling strategies using metal-containing probes (antibodies), the quantification of specific protein biomarkers has been conducted using monoplexed methodologies. (18,19) This is mostly due to the limitation of most ICP-MS mass analyzers (quadrupoles) for monitoring more than one isotope in fast (microsecond-range), transient, multi-isotopic signals originated by individual cells. The inclusion into the market of the CyTOF instrument with the capabilities of conducting such kind of measurements has opened many possibilities for quantitative experiments. (20,21) However, adequate quantitative strategies must be developed and tested before being routinely used.
In this work, two quantification methodologies will be applied and compared using SC-ICP-MS and CyTOF in the specific problem of addressing the absolute number of CD20 receptors present in different cell suspensions. In both the case of SC-ICP-MS and CyTOF, the use of calibration strategies is based on the application of inorganic standards but taking into account the singularities of CyTOF. A comparison of both techniques, as well as the effect of sequential versus simultaneous monitoring of cell elemental markers, will also be evaluated. The quantification possibilities will be applied to cell cultures of chronic lymphocytic leukemia (MEC-1) and to samples of isolated lymphocytes from healthy individuals and patients with chronic lymphocytic leukemia.
Materials and Methods
Instrumentation
All ICP-MS experiments during this study were performed using the triple quadrupole instrument iCAP TQ-ICP-MS (Thermo Fisher Scientific, Bremen, Germany) in the oxygen-TQ mode for the measurement of phosphorus (mass shift from 31P+ to 31P16O+ after reaction with oxygen in the reaction cell), an on-mass approach using helium as a collision gas to break down the 40Ar16O+ interference on the most abundant isotope of iron 56Fe+ and SQ-mode (single quadrupole mode) for 175Lu+ and 193Ir+ monitoring. For the single-cell experiments, the ICP-MS instrument was fitted with the High Efficiency Sample Introduction System (HE-SIS, Glass Expansion, Weilburg, Germany). The cells were pumped using a microflow syringe pump SP101i (Florida, USA) fitted with a 1 mL Hamilton syringe (Nevada, USA) at 10 μL min–1. The data were recorded in time-resolved analysis mode during 3 min per analysis using a dwell time of 5 ms. Under these conditions, only a single isotope could be measured in one run due to the sequential nature of the measurements in a quadrupole system. The studies of the labeled antibody were carried out by connecting online the size exclusion chromatography (SEC), using an HPLC system Agilent 1260 equipped with a quaternary pump (Agilent Technologies, Tokyo, Japan), to the iCAP TQ-ICP-MS instrument as an elemental detector. The column used for the separation was a Superdex 200 10/300 GL (300 × 10 mm, GE Healthcare, Merck, Germany) that has a fractionation range from 10 to 600 kDa. The cell number was determined by absolute counting in a Neubauer chamber.
The CyTOF experiments were conducted in the CyTOF XT Model (Standard BioTools, San Francisco, CA, USA). The CyTOF technology is based on ICP-MS technology including a time-of-flight (TOF) mass analyzer. (22) In order to maximize sensitivity, the mass range is limited to m/z = 75–209. The sample introduction system consists of an autosampler using a two-valve combination that handles the sample introduction to the nebulizer and the washing of all tubing and the nebulizer after each sample. Therefore, the sample introduction and cleaning between specimens are fully automatized. The samples are placed in vials in a refrigerated carrousel at 4 °C. Before measurement, each sample is shaken, and EQ6 Calibration Beads (Standard BioTools) are added at a 10% dilution. These beads contain natural isotopic compositions of Y, In, Ce, Tb, Lu, and Bi and are used for instrument calibration and data normalization. Once mixed with the sample, the suspension is loaded into a 300 μL loop and then pumped into the nebulizer at a constant flow rate of 30 μL min–1. The microflow concentric nebulizer was placed in a spray chamber heated at 200 °C. This reduced the amount of solvent being introduced into the plasma, avoiding a decrease in plasma temperature and ionization efficiency due to solvent effects.
Results and Discussion
Quantitative Strategies: SC-ICP-MS versus CyTOF for Cells Treated with Lu-Labeled Anti-CD20 in MEC-1 Cells
The knowledge of the levels of expression of potential target antigens by the malignant cells, CD20 in this case, could provide a possible rationale for the selection of a specific monoclonal antibody for therapy. With this aim, MEC-1 cultured cells and patient samples of chronic lymphocytic leukemia were treated with the Lu-labeled rituximab according to the procedures section. Two instrumental setups were tested for Lu quantification: SC-ICP-MS and CyTOF. In both cases, apply inorganic Lu standards for calibration. Iridium was used as a cell marker to be measured simultaneously by CyTOF and sequentially under previously optimized conditions by SC-ICP-MS. Antibody titration was conducted to ensure complete labeling of all the receptors (see Figure S4). Briefly, cell samples were incubated with increasing amounts of antibody, until the signal intensity was not increased. The labeling concentration of the antibody was chosen as the minimum amount producing maximum signal intensities (0.5 μg per sample). Figure 3A shows the number of events detected for P (endogenous), Ir (cell marker), and Lu (anti-CD20) for three sequential measurements of the MEC-1 cells by SC-ICP-MS. As can be seen, under the previously optimized conditions, no significant differences can be detected between the three elements using a Student’s t test (5% confidence), except for the Ir in replicate 2. Even in this case, phosphorus and lutetium showed a comparable number of events. Therefore, Lu quantification was further done by applying eq 1 with calculated transport efficiencies based on the analysis of gold nanoparticles.
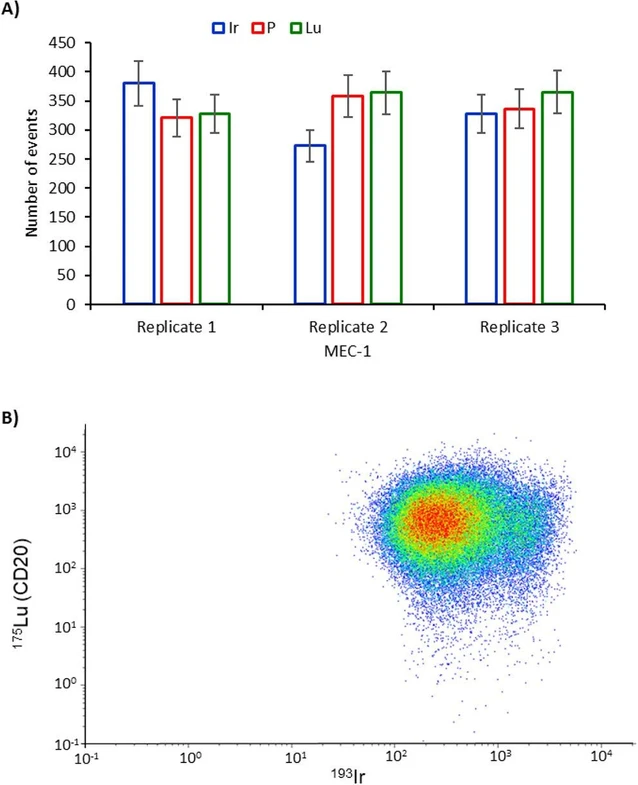 Anal. Chem. 2025, 97, 46, 25510–25518: Figure 3. A) The number of events detected for the MEC-1 cells after labeling with Rituximab and monitoring Ir, P, and Lu by SC-ICP-MS. B) Same cell suspension analyzed by CyTOF, measuring Lu and Ir simultaneously within the same cell event.
Similarly, the same samples were then analyzed using CyTOF. For this aim, the standards were acquired, and after adequate calculations, the calibration curve correlating event intensity with the mass of Lu was constructed. It is important to note that, whereas the standard solution contains natural isotopic compositions of Lu, the antibodies were labeled with isotopically enriched 175Lu. Therefore, adequate corrections were made to consider the difference in the isotopic composition of natural Lu used in the standards applied for calibration (97.4% 175Lu) and the isotopically pure 175Lu used for the labeling. The dot-plot diagram of the cell event intensity observed in the CyTOF is shown in Figure 3B for the MEC-1 cells representing the intact cell events containing Ir and Lu (about 3.6 × 10⁴ measured cells) and revealing a higher cell density (red dots) in a relatively homogeneous distribution.
Quantitative results using the two strategies for the MEC-1 cells are shown in Figure 4 for four independent cell cultures analyzed in parallel using SC-ICP-MS and CyTOF and measured on different days. The SC-ICP-MS results revealed a Lu content of 0.18 fg Lu/cell, calculated as the mean of medians obtained for each replicate. In all cases, the number of measured cell events was around 300. On the other hand, CyTOF yielded a comparable result, with a mean of the medians of 0.17 fg Lu/cell (about 36,000 cell events). Since these are not Gaussian distributions, using the mean of the medians represents a more robust indication of the central tendency of the data. A Student’s t test to compare these values indicated no significant differences between the SC-ICP-MS and the CyTOF data. However, a general trend observed for the quantitative results revealed a slight bias toward higher values in SC-ICP-MS versus CyTOF, which led to significant differences when comparing the complete distributions according to the Mann–Whitney U test (p < 0.05). This could be ascribed to the automated procedure of data treatment by which multiple-cell events are discarded in CyTOF analysis during data cleanup (23) (manually done in the case of SC-ICP-MS). This reason also explains the broader dispersion of the data from SC-ICP-MS. Since cleaning out multiple-cell events is more efficient in CyTOF, a part of the cell distribution is removed, which reduces data dispersion. However, if the Mann–Whitney U test is applied to the full data set of replicates after outlier removal, differences are again not significant. Therefore, both systems can be applied to accurately quantify the interaction of Rituximab with the CD20 antigen, although the already mentioned limitations must be taken into account in SC-ICP-MS. When translating these values into the number of receptors per cell by considering the stoichiometry of the Lu atoms per antibody, the obtained values are in the range of 1.0 × 10⁴ per cell in the MEC-1 cells. These results are similar to the levels obtained in lymphocytic leukemia patients (about 9–10 × 103) reported in a previous publication using flow cytometry. (8)
 Anal. Chem. 2025, 97, 46, 25510–25518: Figure 4. Comparative results obtained for the expression of CD20 in MEC-1 cells using the SC-ICP-MS and CyTOF approaches after labeling with Lu. Empty boxes correspond to SC-ICP-MS data, and dashed boxes correspond to CyTOF results.
Conclusions
The sequential quantification of several elements in a given cell suspension has proven to be adequate when the dilution of the samples is conducted immediately before charging the syringe, and the cell suspensions are stored at 4 °C until that moment. In that case, a similar number of cell events for all of the elements in all of the replicates can be obtained, proving the suitability for sequential quantification. In this regard, the use of inorganic standards applied on ICP-MS for quantification has also shown to be adequate to calculate the elemental content of cells when using CyTOF measurements. When comparing SC-ICP-MS and CyTOF for the same cell suspension labeled with an immunotherapeutic agent, Rituximab, comparable quantitative results are obtained in terms of median values. However, the dispersion of the results is generally higher in the case of SC-ICP-MS where an average number of events of approximately 300 is significantly lower than the 36,000 events measured in CyTOF. There is also a loss of simultaneous single-cell information in SC-ICP-MS due to the sequential detection of different elements, but its high sensitivity may compensate for this drawback for low-expression biomarker quantification. In any case, both approaches have shown promise and may be particularly beneficial for patients with a relatively low expression of the target.