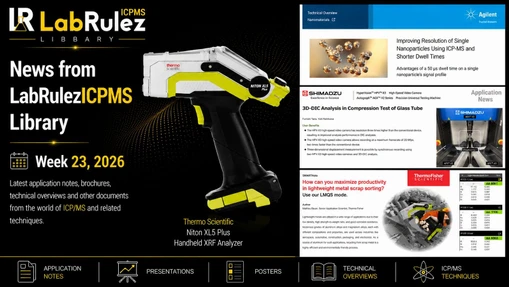
News from LabRulezICPMS Library - Week 11, 2026
LabRulez: News from LabRulezICPMS Library - Week 11, 2026
Our Library never stops expanding. What are the most recent contributions to LabRulezICPMS Library in the week of 9th March 2026? Check out new documents from the field of spectroscopy/spectrometry and related techniques!
👉 SEARCH THE LARGEST REPOSITORY OF DOCUMENTS ABOUT SPECTROSCOPY/SPECTROMETRY RELATED TECHNIQUES
👉 Need info about different analytical techniques? Peek into LabRulezLCMS or LabRulezGCMS libraries.
This week we bring you application notes by Agilent Technologies, Metrohm, Shimadzu and Thermo Fisher Scientific!
1. Agilent Technologies: Spectral Transmission Measurements of Pharmaceutical Packaging
Using the Agilent Cary 60 UV‑Vis Diffuse Reflectance Accessory following EP <3.2.1>, USP <660>, and USP <661.2>
- Application note
- Full PDF for download
Pharmaceutical containers play a significant role in maintaining final drug stability, integrity, and safety, from manufacturing to distribution to the end user. The ability of the packaging system to protect the drug from external agents is critical for quality assurance. Therefore, all pharmaceutical packaging systems must conform to stringent standards.
Plastic and glass are commonly used materials for packaging, and they are typically transparent or opaque. Transparency to ultraviolet (UV) light can pose a risk to light‑sensitive pharmaceuticals, as exposure can initiate adverse—and sometimes harmful—photochemical reactions that can significantly affect drug quality and reduce shelf-life.1
The EP and USP define well-established standards, designed to measure physiochemical and functional properties of packaging components intended to contain a drug product (pharmaceutical containers), to meet regulatory requirements. The EP Chapter <3.2.1> Glass Containers for Pharmaceutical Use includes a functionality test method to demonstrate adequate light resistance of colored glass containers through spectral transmission measurement. An included acceptance criterion specifies the allowed maximum amount of light transmitted by the tested material, defined by the drug product dosage administration form. For example, for glass containers that package oral drug products, the acceptance criterion defines that the observed spectral transmission should not exceed 10% at any wavelength in the range of 290 to 450 nm (< 10%T).2 The identical test and criterion are found in USP Chapter <660> Containers – Glass.3 In addition, the USP Chapter <661.2> Plastic Packaging Systems for Pharmaceutical Use also includes the analogous functionality test method and acceptance criterion for plastic pharmaceutical packaging.4
The Cary 60 UV-Vis spectrophotometer, equipped with the Cary 60 UV-Vis DRA, was chosen for measurement due to its extended ability to reliably measure precise transmission of scattering materials (Figure 1). The Cary 60 UV-Vis is a versatile spectrophotometer; however, measuring materials like plastics and glass, which are textured, translucent, or opaque in a manner that scatters light can result in challenges in satisfactorily measuring light transmittance with standard techniques. In a standard spectrophotometer, scattering materials tend to diffuse transmitted light, deviating an unquantifiable amount of light from the direct optical path of the detector. The detector may not collect all the scattered (lost) light, resulting in inaccurate measurements and results.
For this reason, the Cary 60 UV-Vis was equipped with an internal DRA, which uses a 50 mm integrating PTFE-coated sphere that easily sits inside the spectrophotometer's sample compartment. For these applications, using a DRA can optimize light collection. The sphere's design captures all scattered light uniformly, overcoming scattering losses for accurate measurement of transmitted light. In applications where total transmission is crucial for quality assurance, the DRA is an essential tool for accurate measurements.
Conclusion
In this application note, an Agilent Cary 60 UV-Vis spectrophotometer, fitted with an Agilent Cary 60 UV‑Vis DRA, was used to reliably and quickly determine the spectral transmission of packaging systems used for pharmaceuticals, following the EP <3.2.1>, USP <660>, and USP <661.2> test methods for functionality of light-resistant packaging systems. The integrating sphere enabled the instrument to accurately measure total transmittance of plastic and glass (scattering) materials.
All containers presented less than the defined maximum %T specification, demonstrating light-resistance functionality for containing light-sensitive drug products for oral administration. This method illustrates the importance of accurate testing for quality assurance of pharmaceutical packaging. The Agilent Cary 60 UV-Vis spectrophotometer, paired with Cary WinUV Pharma software, delivers secure data management and compliance for regulated pharmaceutical labs.
2. Metrohm: Multiparameter hops analysis by near-infrared spectroscopy (NIRS)
Rapid determination of alpha acids, beta acids, cohumulone content, total oil content, HSI, and moisture
- Application note
- Full PDF for download
The quality of hops and hop pellets is vital across the entire brewing supply chain. Traditional methods used for quality control (e.g., titration and HPLC) are highly accurate and widely accepted. They are also time consuming, labor intensive, and dependent on chemical reagents which not only incur ongoing material costs but also require careful handling and proper disposal. Near-infrared spectroscopy (NIRS) offers a compelling alternative when ultra-high precision is not necessary. It enables the rapid analysis of multiple parameters within a minute without using any chemicals. This Application Note outlines the measurement setup and the results of cohumulone, hop oils, and moisture content, the hop storage index (HSI), and hops acids analysis with NIRS.
EXPERIMENTAL EQUIPMENT
More than 500 fresh hop samples and ground hop pellets were analyzed on an OMNIS NIR Analyzer Solid (Figure 1). The samples were added to an OMNIS sample cup and analyzed in diffuse reflection mode. To include sample variety, the sample rotated during measurement to collect spectra from different locations. The automatically averaged spectra were used for model development. Spectra acquisition, model development, and validation were carried out with the OMNIS Software.
Reference values for alpha acids were obtained using various official methods, including EBC 7.4, EBC 7.5, and EBC 7.7. Total oils and beta acid content were determined using EBC 7.4, while EBC 7.7 was employed for cohumulone analysis. Moisture content and the hop storage index (HSI) were measured using a halogen moisture analyzer and a UV-VIS photometer, respectively.
CONCLUSION
This Application Note demonstrates the feasibility of using NIR spectroscopy for the analysis of freshly harvested hops and ground hop pellets to determine cohumulone, moisture, and total oil content, HSI, and alpha and beta acids. Using alpha acids as an example, the difference between a prediction model covering the full concentration range and a model specific to a narrower range was highlighted. The latter reduced the prediction error by a factor of two.
Users can apply this approach to maximize accuracy. In the OMNIS Software, both models can be combined to automatically perform the following sequence. First, the alpha acid concentration is estimated using the broad-range model; then, a more precise prediction is made using the restricted-range model.
3. Shimadzu: Observation of Acrylic Block Fracture during Impact Compression Using the Hopkinson Bar Method
- Application note
- Full PDF for download
User Benefits
- The HPV -X3 offers three times the resolution of conventional models, enabling observation of specimen fracture at much higher resolution.
- With a maximum frame rate of 20 Mfps, the HPV-X3 is well-suited for observing high-speed phenomena such as an impact test
Understanding materials properties is critical to product design. In particular, for applications such as transportation equipment, where materials may be subjected to impact loads, it is essential to evaluate not only static properties but also impact properties. When subjected to impact, materials may exhibit stress and strain characteristics different from those under static loading, making it essential to quantify these characteristics through impact testing.
The Hopkinson bar method is a well-established technique for impact compression testing. Proposed by B. Hopkinson, this method enables detailed analysis of a material’s impact response and evaluation of its fracture properties by subjecting the specimen to a sudden force using a bar-launching device. This paper presents an example of an impact compression test on an acrylic specimen with a central circular hole, recorded with an HPV-X3 high-speed video camera (Fig. 2) using the Hopkinson bar method.
Imaging System
The imaging devices are listed in Table 1, and the imaging conditions are listed in Table 2. As shown in Fig. 4(b), laser illumination was directed from the rear of the specimen toward the lens, and imaging was performed with the HPV-X3 using a close-up ring, bellows, and macro lens. This setup enabled observation of the fracture process in the acrylic block. Two types of imaging were conducted: observation of crack propagation immediately after loading, and observation of subsequent fracture.
Conclusion
The impact compression test of an acrylic specimen using the Hopkinson bar method was observed using the HPV-X3 highspeed video camera. Inside the compressed specimen, the propagation of a wavefront believed to be a stress wave was first observed. Subsequently, cracks propagated from the central circular hole toward the left and right surfaces, and finally, diagonal cracks formed, leading to complete fracture. The progress of this series of fracture processes was clearly captured.
The HPV-X3 has three times the resolution of the previous HPVX2 model, enabling more detailed observation of specimens during impact tests, including the Hopkinson bar method. Furthermore, because fracture phenomena during impact testing occur at high speeds, the HPV-X3, which can record images at up to 20 Mfps, is ideal for capturing them.
4. Thermo Fisher Scientific: Analysis of silica in air filters using ARL X’TRA Companion X-ray Diffractometer
- Application note
- Full PDF for download
The analysis of silica in air filters is a critical aspect of occupational health and safety, aimed at protecting workers from the harmful effects of inhaling crystalline silica particles, which can lead to diseases such as silicosis and lung cancer. The NIOSH 7500 method (NIOSH, 2003) provides a detailed and standardized procedure for the determination of crystalline silica in air samples using X-ray diffraction (XRD). This method involves the collection of air samples on filters, which are then analyzed to identify and quantify the crystalline silica phases, including quartz, cristobalite, and tridymite.
XRD is chosen for its high specificity and sensitivity in distinguishing different crystalline forms of silica, making it a reliable analytical technique. The method outlined in NIOSH 7500 requires meticulous sample preparation, including the proper collection and handling of air filters, calibration with known standards, and strict adherence to analytical parameters to ensure accurate and reproducible results. Following the NIOSH 7500 norm and equivalent standards helps ensure the reliable monitoring of workplace air quality, thereby safeguarding workers’ health. The use of XRD in analyzing silica in air filters is an essential component of industrial hygiene and environmental monitoring programs, facilitating the detection and control of hazardous silica exposure in occupational settings.
Instrument and software
The Thermo Scientific™ ARL™ X’TRA Companion X-ray Diffractometer (c.f. Figure 1) is a simple, easy-to-use benchtop XRD instrument for routine phase analysis as well as more advanced applications. The ARL X’TRA Companion XRD uses a θ/θ goniometer (160 mm radius) in Bragg-Brentano geometry coupled with a 600 W X-ray source (Cu or Co). The radial and axial collimation of the beam is controlled by divergence and Soller slits, while air scattering is reduced by a variable beam knife. An integrated water chiller is available on demand. Thanks to the innovative solid state pixel detector (55 x 55 μm pitch), the ARL X’TRA Companion XRD provides very fast data collection and comes with one-click Rietveld quantification capabilities and automated result transmission to a LIMS (laboratory information management system).
Your benefits
The ARL X’TRA Companion XRD provides data perfectly suited to quantify respirable quartz in air filters. Utilizing a calibration curve in a one-click refinement delivers results within minutes, ensuring ease-of-use for operators and reducing training requirements. XRD analysis of air filter samples complies with the NIOSH 7500 standard.