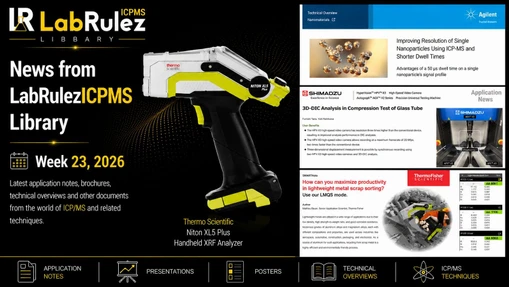
News from LabRulezICPMS Library - Week 25, 2025

LabRulez: News from LabRulezICPMS Library - Week 25, 2025
Our Library never stops expanding. What are the most recent contributions to LabRulezICPMS Library in the week of 16th June 2025? Check out new documents from the field of spectroscopy/spectrometry and related techniques!
👉 SEARCH THE LARGEST REPOSITORY OF DOCUMENTS ABOUT SPECTROSCOPY/SPECTROMETRY RELATED TECHNIQUES
👉 Need info about different analytical techniques? Peek into LabRulezLCMS or LabRulezGCMS libraries.
This week we bring you application notes by Agilent Technologies, Metrohm, Shimadzu and Thermo Fisher Scientific and brochure by Anton Paar!
1. Agilent Technologies: Shielding Your Snacks: The Crucial Role of UV-Blocking Food Packaging
Food packaging analysis using the Agilent Cary 60 UV-Vis with diffuse reflectance accessory
- Application note
- Full PDF for download
An important consideration in the design of packaging for perishable food and beverages is the blocking of ultraviolet (UV) light in the 200 to 400 nm range. UV light can reduce the shelf-life of foodstuffs through accelerated degradation by photo-oxidation or light-catalyzed reactions. In addition to blocking light in the UV range, some packaging is required to have a certain level of transparency in the visible range (400 to 900 nm) for aesthetic reasons. Consequently, measuring the transmittance of light in the UV-visible spectrum (200 to 900 nm) is an essential step in designing and testing effective UV barrier materials for food packaging.1
In this application note an Agilent Cary 60 UV-Vis spectrophotometer (Figure 1) was fitted with a Cary 60 UV-Vis DRA (Figure 2) and used to measure the transmission of light through various food packaging types. This internal DRA is an integrating sphere that is fitted within the sample compartment of the Cary 60 UV-Vis spectrophotometer and allows for the measurement of diffuse transmission or reflectance of solid, liquid, and powder samples. Solid food packaging samples are often frosted or textured in a way that results in diffuse transmission of light. Scattering and diffusing samples can be challenging to measure in a standard transmission sample compartment as some of the diffused light can be directed away from the detector and not be collected, leading to inaccurate results. For these samples, the use of DRAs is recommended. An integrating sphere collects and measures all transmitted and forward scattered light from the sample making it an essential tool to gather accurate answers in this application. The solid sample holder of the DRA is simple to use and provides consistent measurements of the UV-Vis transmission spectrum of these different plastic samples
Results and discussion
The ginger and rice packages showed a sharp absorption edge at 330 nm and the gummy bear and sesame wrappers showed one at 305 nm where the %T falls from 85 to 95% to almost 0%. This indicates that the packaging exhibits high transparency in the visible and UVA wavelength range (315 to 900 nm) but absorbs a large amount of UVB light (280 to 315 nm). The milk bottle exhibits a lower transparency in the visible region and is at least semitransparent to UV light. Table 1 shows the mean %T of the samples over the UV (200 to 400 nm) and visible (400 to 900 nm) wavelength ranges. The average standard deviation of %T in these two wavelength ranges was also calculated by taking the standard deviation of five repeat measurements at each measured wavelength in the continuum and averaging that over the two indicated wavelength ranges. Each repeat measurement was performed by rotating and repositioning the sample to reveal inhomogeneity across the sample. The average standard deviation was not more than 0.6%T indicating that the samples and the Cary 60 UV-Vis with the internal DRA can produce accurate measurements of the UV and visible transmittance of different plastics.
Conclusion
The Agilent Cary 60 UV-Vis spectrophotometer with internal DRA was used to measure the total transmission of food packaging materials in the UV-Vis wavelength range. The simple workflow allows for the fast analysis of the UV protection and visible esthetics of a range of solid samples with great confidence. This easy-to-use solution helps users and producers of food packaging products to quickly and reliably check that the food packaging meets their requirements and is fit for the intended purpose.
2. Anton Paar: Benchtop Rheometer HTR 3000
- Brochure
- Full PDF for download
The HTR 3000 by Anton Paar is a fully automated benchtop rheometer designed to revolutionize laboratory workflows by automating rheological measurements of up to 250 samples per day. Developed for concentric cylinder geometries and other relative measuring systems, it eliminates five manual steps and offers up to 54-sample storage capacity—freeing valuable time for researchers. By enhancing reproducibility, ensuring safety, and reducing the burden of routine tasks, the HTR 3000 is an ideal solution for high-throughput testing environments where precision and data integrity are critical.
This compact system integrates seamlessly with Anton Paar’s MCR 102e or MCR 302e rheometers, offering advanced capabilities such as automatic temperature conditioning, pH measurement, and sample tracking via barcodes. Optional features include a waste unit, gravity caps, priority sample drawer, and a tempered rack for handling sensitive materials. A sophisticated cleaning unit for the upper measurement geometry is also included, further minimizing manual handling and contamination risks.
The HTR 3000 is tailored for multiple industries, with configurations available for coatings, personal care, food, chemicals, and agrochemicals. For example, in the food sector, its temperature-controlled rack preserves perishable samples, while in the chemical industry, its monitored ventilation and waste unit provide safe analysis of hazardous materials. Integration with laboratory information management systems (LIMS) ensures secure, traceable data export and supports compliance with pharmaceutical and quality standards.
Its modular architecture allows laboratories to scale the system to their needs and challenges, whether in R&D or QC. Combined with Anton Paar’s robust global support network and a three-year warranty, the HTR 3000 delivers a high return on investment while preparing labs for the future of automated, precise rheological analysis.
3. Metrohm: Through-container analysis with Raman spectroscopy
Safely identify materials without contact
- Application note
- Full PDF for download
The innovative Metrohm TacticID-1064 ST allows users to test through packaging and analyze the contents. See-through analysis is fast, easy, and prevents operator and material exposure to potential contaminants. TacticID-1064 ST is the first handheld 1064 nm Raman device capable of testing through paper, plastic, and glass barriers—even mixed, multilayer, or colored materials.
First responders facing potentially deadly substances and situations benefit most from see-through sampling. From content ID of a suspicious bag during a traffic stop to analysis of homemade incendiary devices, every second counts and nothing can be left to chance. TacticID-1064 ST also benefits manufacturers who perform raw material verification. Operators can test container contents without exposure and get results in seconds. This streamlines QC and supports 100% testing of incoming goods. It also enables 90% of testing to happen at the point of receipt and avoids delays in production due to laboratory wait times.
Introduction
All Raman systems have some inherent ability to test through thin and transparent barriers like glass vials and clear plastic. Thick barriers—especially opaque or colored glass, plastic, and multiple layers of paper—require a modified optical system. TacticID1064 ST (TID1064ST, Figure 1) handheld Raman system uses 1064 nm laser excitation to penetrate through packaging and analyze the contents of almost any container. The ability to identify the contents of containers without opening them significantly expands a device's application range. This means that users can perform non-invasive scans for identification of unknowns or quality control in manufacturing. Ultimately, TID1064ST can enhance the safety, efficiency, and accuracy of material identification.
Conclusion
TacticID-1064 ST is the first 1064 nm Raman system capable of «see-through» analysis, allowing users to identify the contents of containers without opening them. The ability to test through barriers ensures that users can perform more scans in more locations, enhancing safety, efficiency, and accuracy in their work.
4. Shimadzu: Fracture Observation in Glass Ring-on-Ring Bending Tests Using HPV-X3
- Application note
- Full PDF for download
User Benefits
- The HPV-X3 high-speed video camera has a resolution three times higher than conventional models, allowing for high-resolution, high-speed imaging.
- The HPV-X3 makes it possible to observe the origin of glass fractures and the propagation of cracks while allowing high-speed imaging at a maximum of 20 Mfps
In recent years, glass is being used in a diverse range of applications, including electronics, automobiles, and architecture. For example, smartphone screens and automobile windshields demand high-strength glass, so three-point bending tests, four-point bending tests, and ring-on-ring bending tests are used to evaluate strength. In three-point and four-point bending tests, the results depend on the condition of the edges since cracks at the edge of the test piece can become the origin of a fracture. On the other hand, the ring-on-ring bending test is considered a biaxial four-point bending test, and it can evaluate the ‘in-plane strength’ of glass without being influenced by the edges. This test is specified in ASTM C1499, and the pass or fail judgment is determined by observing the origin of the fracture on the specimen with tape applied to the compression side. Accordingly, it is important to not only perform the test but also to confirm the origin of the fracture.
In a previous report1) , the fracture process of strengthened glass in a ring-on-ring bending test was observed using the HPV-X2 high-speed video camera. The newly developed HPV-X3 (Fig. 1) has a resolution three times higher than the HPV-X2, allowing for more detailed observation of glass cracks.
Measurement Result
Fig. 4 shows the results of the fracture observation in the ringon-ring bending test. In (2), the fracture origin on the load ring can be seen, and then, from (3) to (12), the propagation of the cracks can be observed as the circle of origin expands. Fig. 5 compares the images captured with the HPV-X2 in the previous report with the newly captured images taken using the HPV-X3. The image from the HPV-X3 in Fig. 5 is an enlarged view of the crack area from Fig. 4(4). Similarly, the image from the HPV-X2 in Fig. 5 is an enlarged view of the crack area from the previous report. In the HPV-X2 image, the outline of the black circle at the fracture is somewhat unclear. In contrast, the HPV-X3 allows for the identification of cracks radiating from the fracture origin, and it can be seen that the improved resolution enables more detailed observation.
Conclusion
The fracture behavior in the ring-on-ring bending test of tempered glass was observed using the HPV-X3 high-speed video camera. The crack propagation speed in glass is very fast, which makes a high-speed video camera with a recording speed of over 5 Mfps suitable for these observations. The resolution of the HPV-X3 has been improved threefold compared to the conventional HPV-X2, allowing for clearer imaging of the cracks. In this way, the HPV-X3 can contribute to the development of glass.
5. Thermo Fisher Scientific: Detection of APIs in Pharmaceutical formulations using ARL X’TRA Companion X-ray Diffractometer
- Application note
- Full PDF for download
X-ray diffraction (XRD) is a powerful analytical technique widely used in the pharmaceutical industry for the identification and characterization of active pharmaceutical ingredients (APIs) and excipients such as hydroxypropyl methylcellulose (HPMC) and other diluents. XRD provides detailed information about the crystalline structure, phase composition, and purity of materials, which are critical for ensuring the quality and efficacy of pharmaceutical products. By analyzing the diffraction patterns produced when X-rays interact with the crystalline lattice of a substance, XRD enables the precise identification of chemical compounds and polymorphic forms. This is crucial for APIs, whose therapeutic effectiveness can be influenced by their crystalline form. Additionally, XRD helps in evaluating the compatibility and stability of excipients like HPMC, which are used to control drug release and enhance product performance. The ability to detect low levels of APIs within excipients ensures that the final product meets stringent quality standards. Overall, XRD is an essential tool in the pharmaceutical industry for quality control, formulation development, and regulatory compliance.
Instrument & software
The Thermo Scientific™ ARL™ X’TRA Companion X-ray Diffractometer (c.f. Figure 1) is a simple, easy-to-use benchtop XRD instrument for routine phase analysis as well as more advanced applications. The ARL X’TRA Companion XRD uses a θ/θ goniometer (160 mm radius) in Bragg-Brentano geometry coupled with a 600 W X-ray source (Cu or Co). The radial and axial collimation of the beam is controlled by divergence and Soller slits, while air scattering is reduced by a variable beam knife. An integrated water chiller is available on demand. Thanks to the innovative solid state pixel detector (55 x 55 μm pitch), the ARL X’TRA Companion XRD provides very fast data collection and comes with one-click Rietveld quantification capabilities and automated result transmission to a LIMS (laboratory information management system).
Results & Discussion
By comparing the data to the theoretical XRD peak positions of resveratrol (Figure 2) it is possible to identify this compound in mixtures down to 1 wt.% fraction. This allows to identify low levels of API as well as contaminations with polymorphs or unwanted materials. From a linear regression the LoD was calculated (3*standard error of estimate) to 0.2 wt.% for this specific experiment.
Your Benefits
The ARL X’TRA Companion XRD yields data perfectly suited to identify APIs in mixtures with excipients like HPMC down to at least a LoD of 0.2 wt.%, which is required to control the quality of pharmaceutical formulations. This ensures compliance with stringent quality standards and supports the development of effective pharmaceutical products.