Simultaneous UV/vis Absorption in Parallel Configuration, Photoluminescence and Raman Spectroelectrochemistry
ACS Electrochem. 2025, 1, 6, 997–1002: Graphical abstract
Analytical chemistry seeks to obtain the most complete information possible about chemical systems, and recent advances enable the integration of multiple analytical signals. This note presents a novel combination of UV/vis absorption spectroscopy in parallel configuration, photoluminescence, and Raman spectroscopy with electrochemistry.
Using tris(2,2′-bipyridine)ruthenium(II) and ofloxacin as test systems, the method demonstrates the advantages of capturing complementary spectroscopic signals during the same electrochemical process. By uniting three techniques in one experiment, this approach provides a richer understanding of chemical behavior and enhances spectroelectrochemical analysis.
The original article
Simultaneous UV/vis Absorption in Parallel Configuration, Photoluminescence and Raman Spectroelectrochemistry
Fabiola Olmo, Martin Perez-Estebanez, Aranzazu Heras*, Francisco Javier del Campo, Alvaro Colina*
ACS Electrochem. 2025, 1, 6, 997–1002
https://doi.org/10.1021/acselectrochem.5c00038
licensed under CC-BY 4.0
Selected sections from the article follow. Formats and hyperlinks were adapted from the original.
Spectroelectrochemistry (SEC) provides a great amount of information in a single experiment, since it permits the following of a system from two different points of view: electrochemical and spectroscopic. (1) To enhance the capabilities of electrochemical analysis, we propose to implement new multiresponse techniques that enable the simultaneous recording of multiple signals. (2,3) Several SEC devices combining two spectroscopic techniques have been developed by our group in the past, promoting the development of new SEC techniques such as bidimensional UV/vis absorption SEC, (3,4) the combination of fluorescence and UV/vis absorption SEC, (5) or the combination of Raman scattering and UV/vis absorption SEC. (6) Nevertheless, to the best of our knowledge, this is the first time that electrochemistry is coupled to three different spectroscopic techniques simultaneously.
In this technical note, we propose a novel design that allows the straightforward and reproducible coupling of operando and simultaneous SEC measurements of UV/vis absorption spectroscopy, Raman scattering, and photoluminescence (PL). This new setup focuses on the wealth of information that all these techniques can provide in the study of a chemical system. UV/vis SEC provides molecular information about the compounds present or electrogenerated at the electrode/solution interface and in the diffusion layer. PL SEC also allows the acquisition of data regarding the location and characteristics of molecules at the electrode/solution interface and within the diffusion layer, achieving a higher degree of specificity and sensitivity than UV/vis absorption SEC, as these molecules are fluorescent. Finally, Raman SEC provides vibrational characterization of the compounds, being surface-sensitive due to the Surface Enhanced Raman Scattering (SERS) phenomenon.
To characterize complex systems, such as electrode processes, (7,8) SEC experiments can be performed separately, changing the optical technique used in each case. Nevertheless, our proposal is that the simultaneous combination of different analytical techniques represents a better strategy, as it facilitates the study of the same chemical system under the same experimental conditions, thereby avoiding any influence of irreproducibility among consecutive experiments. In some cases, the studied system can exhibit inherent reproducibility issues, making it difficult to establish reliable correlations between experimental results.
Experimental Section
Design and Fabrication of the Device for UV–vis absorption/PL/Raman SEC Measurements
Figure 1 shows the multi-SEC cell for the simultaneous recording of UV/vis absorption, PL, Raman, and electrochemical signals. This cell consisted of three main parts: I) support of the screen-printed electrode (SPE), II) holder of the optical fibers for UV/vis absorption measurements in a parallel configuration, and III) holder of the optical fibers for PL measurements. A detailed description of the SEC cell is provided in the SI.
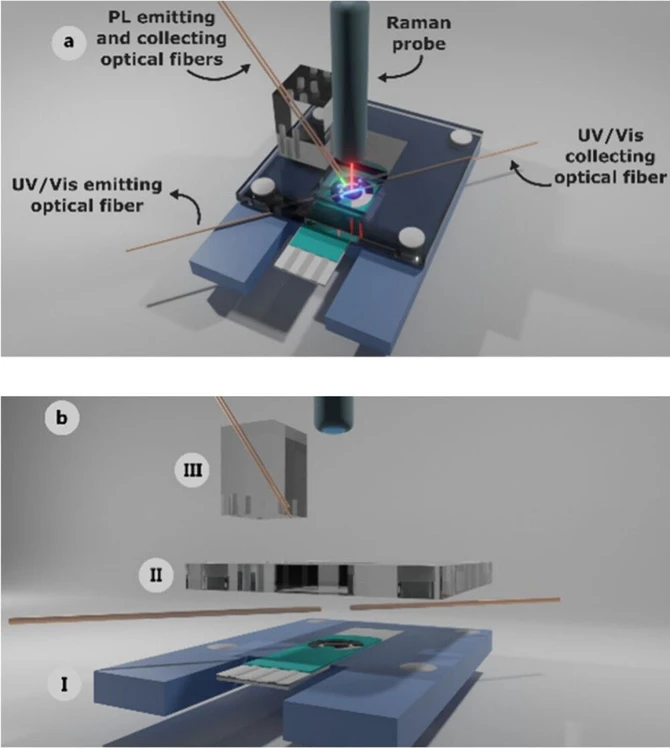 ACS Electrochem. 2025, 1, 6, 997–1002: Figure 1. (a) Schematic of the assembled UV/vis absorption/PL/Raman SEC cell and (b) detailed schematic view of each part of the cell. (I) Lower piece, (II) Middle piece and (III) Upper piece.
Results and Discussion
Application of the Cell to Study a Bactericidal Molecule
Experiments with Ru(bpy)32+ allowed us to demonstrate that simultaneous information from four different points of view can be obtained with the cell proposed in this work. As proof of concept, the oxidation of a fluorescent organic molecule, ofloxacin (OFL), a commonly used antibiotic, is proposed. This system was selected because its spectroscopic behavior is similar to Ru(bpy)32+, but its Raman response is quite different. In addition, the study of this molecule is of great interest because of its widespread use as a bactericidal agent. OFL exhibits characteristic UV/vis absorption, fluorescence emission, and Raman spectra that change when subjected to electrochemical oxidation processes. The performance of time-resolved experiments in which the evolution of the electrochemical signal, molecular absorption, fluorescence emission and Raman spectra are recorded simultaneously will be of great help in determining its reaction mechanism, which may help to understand its mode of action as a bactericidal antibiotic. (17,18)
For this purpose, a 5 × 10⁻⁴ M OFL solution in Britton-Robinson buffer (BR, pH = 4.25) was prepared to perform SEC experiments while maintaining the above experimental conditions. Similarly, CV was selected as the electrochemical technique. In this case, changes were recorded between the vertex potentials +0.00 V and +1.10 V, starting at +0.60 V in the cathodic direction. Two scans were registered at 0.02 V·s–1, and the initial spectrum at OCP was selected as reference for UV/vis absorption measurements. All spectra obtained using the three techniques were recorded at an integration time of 1 s. However, a different integration time could be used for each individual technique, depending on the signal to noise ratio.
Figure S5 shows the contour plots for each spectroscopic technique registered during the SEC experiment for the oxidation of OFL. In this case, the evolution of UV/vis absorption spectra (Figure S5a) is characterized by a strong negative absorption band at 303 nm which corresponds to a π–π* electronic transition of the chromophore of OFL that involves a carboxyl group and the nitrogen atom at position 1 in the quinolone group, and a broad negative shoulder between 330 and 370 nm, linked to an n−π* electronic transition of the chromophore of OFL from the nitrogen of the piperazinyl group to the carbon at position 7 in the quinolone group attached to the carbonyl group; both bands are related to the consumption of OFL on the WE surface due to its oxidation. (2) The evolution of PL spectra (Figure S5b) shows a band at 521 nm that decreases during the oxidation of OFL that it is accompanied by a small shoulder between 390 and 460 nm that increased during this oxidation process. (19) The emission band peaking at 521 nm is related to the protonated form of OFL, indicating again the consumption of this molecule by the oxidation process. The increase in the shoulder at shorter wavelengths must be linked with the oxidation product electrogenerated. (20) To facilitate a more accurate visual representation of the photoluminescence signal’s evolution, Figure S5b illustrates its variation throughout the experiment, taking the initial fluorescence spectrum of the solution as a reference spectrum (ΔIPL = IPL,t – I0, where IPL,t is the photoluminescence intensity at different times/potentials applied during the experiment, and I0 corresponds to the photoluminescence intensity of the initial spectrum of the solution). Finally, the evolution of the Raman spectra (Figure S5c) is dominated by two peaks at 1397 and 1619 cm–1 that evolve during the second potential cycle. The first one is due to the symmetric stretching mode of the carboxylate group (νring, COO–), and the second characteristic band is attributed to the C═C stretching vibration of the quinolone aromatic ring (νs, C═C). (21,22)
Figure 3a shows the corresponding CV. No reduction peak was observed during the first cathodic scan. When the potential is reversed in the anodic direction, a first oxidation peak (O1) at +0.95 V is observed due to the oxidation of the AuNPs and OFL. OFL is irreversibly oxidized, as was demonstrated in previous works. (2) Regarding the second cycle, a cathodic peak (R2) is observed at +0.28 V, corresponding to the reduction of AuNPs, oxidized at potentials higher than +0.75 V, which agrees with the experiments with Ru(bpy)32+.
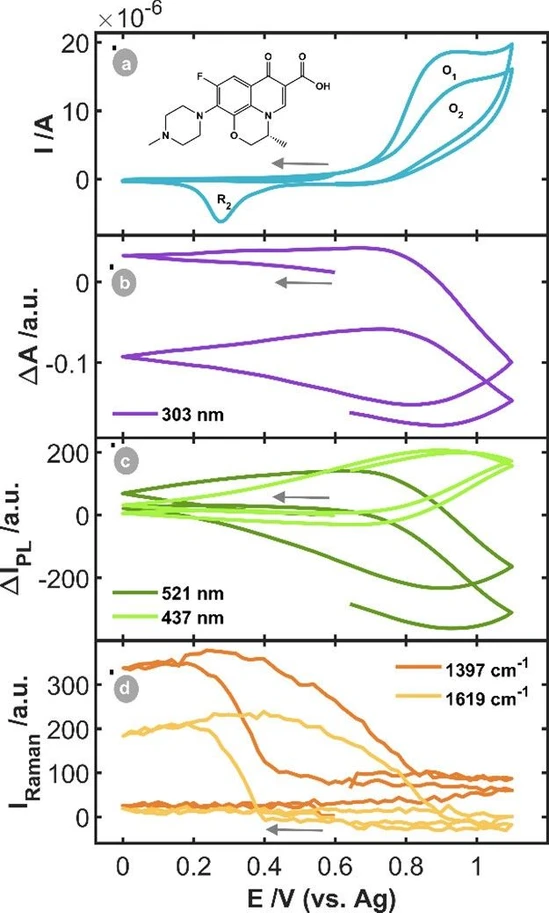 ACS Electrochem. 2025, 1, 6, 997–1002: Figure 3. SEC experiment of 5·10–4 M OFL in BR pH = 4.25 between the vertex potentials +0.00 V and +1.10 V, starting at +0.60 V in the cathodic direction at 0.02 V·s–1. (a) CV and (b) CVA at 303 nm, (c) CVF at 521 and 437 nm and (c) CVR at 1397 and 1619 cm–1.
The CVA at 303 nm (Figure 3b) and the CVFs at 521 and 437 nm (Figure 3c) show the same behavior. As it is expected, if in the first potential cycle the oxidation potential exceeds +0.75 V, the absorbance at 303 nm and the fluorescence at 521 nm decrease due to the consumption and irreversible oxidation of OFL, while the fluorescence at 437 nm increases due to the generation of the OFL oxidation product. During the backward scan, when the potential of +0.75 V is reached, the CVA at 303 nm and CVF at 521 nm signals increase due to the diffusion of OFL from the bulk solution to the diffusion layer interrogated by the optical probes.
Furthermore, the CVF signal at 437 nm is diminished in intensity when the potential is lower than +0.75 V, owing to the diffusion of the oxidation product into the solution.
The behavior observed in the second potential scan is analogous to that observed during the initial scan. Lastly, the CVRs at the two characteristic bands of OFL (1397 and 1619 cm–1, Figure 3d) show that in the first potential scan OFL is not detected by SERS in the Raman spectra. The Raman intensity does not increase until the AuNPs are reduced in the second cathodic scan, as is observed in Figure S4b (orange lines). The Raman signal at 570 cm–1 demonstrates the oxidation/reduction of AuNPs, Figure S4b. The Raman signal at 1397 cm–1 demonstrates that Raman amplification did not occur when the experiment started toward reduction. The AuNPs must first be oxidized and then reduced to observe the corresponding Raman spectrum, suggesting that the reconstruction of the NPs surface plays a key role in the activation of the SERS phenomenon.
From the results, it can be concluded that the new device allowed us to obtain four independent signals in a single experiment, helping us to understand the chemical processes taking place during an electrochemical process, with all the signals being correlated with each other, providing a full picture of the electrode process. While the UV/vis absorption and PL optical signals show changes throughout the redox process of OFL, the Raman signal demonstrates that an activation of the SERS substrate is needed without prior oxidation and subsequent reduction of the AuNPs, no substrate capable of amplifying the Raman signal is created, and therefore no OFL spectrum is observed up to that point. The oxidation/reduction of AuNPs in this case illustrates that SERS signals are influenced not only by the size and shape of the particles but also by their surface condition, which can facilitate the chemical mechanism of enhancing the Raman signal.
Conclusions
The coupling of electrochemistry with three spectroscopic techniques (UV/vis absorption, PL, and Raman) provides a comprehensive understanding of all the chemical processes involved in the electrode process. This is a major asset, offering a starting point for the analytical procedures used to identify and quantify the molecules of interest in multiple domains.
Raman analysis of OFL has demonstrated that when the experiment begins with a reduction step, no amplification of the Raman signal occurs. In other words, the initial AuNPs do not act as a SERS substrate, because the OFL Raman spectrum is not defined. However, when AuNPs are first oxidized and then reduced, the corresponding Raman spectrum emerges, demonstrating that the reconstruction of the AuNP surface plays a key role in the activation of the SERS phenomenon. This reconstruction suggests a new experimental pathway for the detection of this family of antibiotics using SERS.