A Method for Determination of Transport Efficiency in Laser Ablation Inductively Coupled Plasma Mass Spectrometry for Tissue Analysis
Anal. Chem. 2025, 97, 25, 12940–12946: Graphical abstract
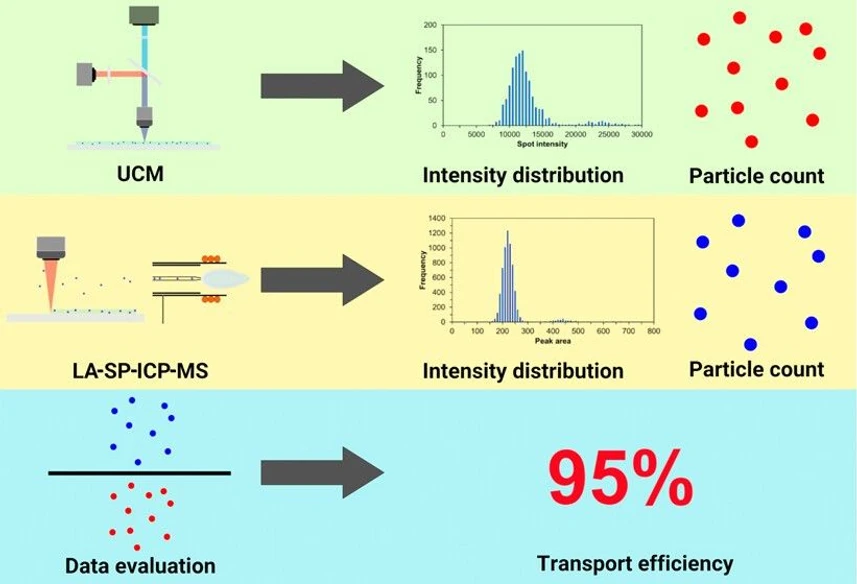
This study presents a novel method for determining transport efficiency (TE) in laser ablation–inductively coupled plasma–mass spectrometry (LA-ICP-MS), based on counting upconversion nanoparticles from gels analyzed by fluorescent microscopy. The approach proved highly effective for a 2940-nm laser ablation system, achieving near-quantitative nanoparticle desorption, with TE largely dependent on ablation cell design and aerosol transport.
For a 213-nm laser, incomplete desorption and nanoparticle redeposition at low fluences could affect TE reproducibility, while a 193-nm laser caused nanoparticle disintegration, raising baseline noise and lowering sensitivity—rendering it unsuitable for TE measurement. This method demonstrates versatility for TE assessment in LA-ICP-MS, while clearly outlining limitations linked to wavelength and fluence.
The original article
A Method for Determination of Transport Efficiency in Laser Ablation Inductively Coupled Plasma Mass Spectrometry for Tissue Analysis
Jaromír Stráník, Vilém Svojanovský, Julie Weisová, Kateřina Uhrová, David Clases, Antonín Hlaváček* and Jan Preisler*
Anal. Chem. 2025, 97, 25, 12940–12946
https://doi.org/10.1021/acs.analchem.5c01306
licensed under CC-BY 4.0
Selected sections from the article follow. Formats and hyperlinks were adapted from the original.
Inductively coupled plasma–mass spectrometry (ICP-MS) stands at the forefront of analytical techniques, pivotal in advancing our understanding of elemental composition across diverse fields ranging from geological applications to environmental monitoring, as well as biological research. Recognized for its excellent sensitivity and precision, ICP-MS enables the quantification of trace elements with remarkable accuracy and, now more often, the characterization of nanoparticles and microparticles. In this analytical landscape, the measurement of transport efficiency (TE) is crucial. TE, which is defined as the ratio of analyte transported from the matrix to the analyte fraction reaching the detector, is a fundamental parameter for the concentration sensitivity of the ICP-MS experiment.
Various methods have been developed to determine TE, particularly for nebulizer sample introduction systems. (1) In single-particle (SP) nebulizer measurements, TE is essential for accurately determining particle number and size. (2,3) Therefore, with the growth of SP analysis by ICP-MS, techniques analyzing particle frequency or particle size of stable (metallic) nanoparticles have become increasingly popular for TE determination. (2−4) Additionally, dynamic mass flow method was proposed in 2020, which is based on measuring directly and continuously the weight of sample uptake and the weight of sample reaching the plasma online over time while the ICP-MS system is in equilibrium and was used for the characterization of nanoparticles. (5)
Determining TE for laser ablation–inductively coupled plasma–mass spectrometry (LA-ICP-MS) is less common and more challenging. Aerosol generation and transport in LA-ICP-MS is a complex process that can be influenced by sample morphology, sample composition, laser parameters, carrier gas, particle size and shape, and other factors related to sample atomization and mass spectrometer setup. (6−9)
Existing methods adapted from solution analysis are not directly applicable. Standard techniques involve capturing aerosols using filters or multilevel impactors, which are often accompanied by an optical particle counter. (10) This is typically followed by sample weighing before and after the ablation process and characterizing the captured aerosol. (10−15) With the growing interest in ablating intact nanoparticles in the SP mode, (16−20) the particle size method has recently found application in laser ablation (LA) systems. (20) Additionally, TE has been determined by applying a suspension of nanoparticles of a known number concentration to tissue sections. (21) In our earlier work, we presented a method for TE determination in which we precisely deposited gold nanoparticles using a piezoelectric dispenser on gelatin sections for LA-SP-ICP-MS analysis and silicon wafers for reference scanning electron microscopy. (19)
However, conventional methods for TE determination have limitations. They often require special equipment and describe the aerosol fate only in the sample introduction system rather than the whole ICP-MS system. Some rely on particle characteristics provided by manufacturers, which are often only approximated, primarily due to an unknown degree of aggregation. Challenges such as nanoparticle suspension aging, pipetting errors, and nanoparticle adsorption during sample preparation underscore the need for a reliable reference method, mainly when precision and accuracy are paramount in TE determination. Recently, nanoparticles embedded in thin polymer films were applied for their characterization and calibration of LA-SP-ICP-MS. (22)
We present a method for determining transport efficiency in LA-ICP-MS using agarose layers containing photon-upconversion nanoparticles (NPs). These lanthanide-doped nanocrystals absorb infrared light (976-nm) and emit at shorter near-infrared and visible wavelengths in a nonlinear photoluminescence process known as photon-upconversion. This unique property enables background-free imaging and accurate single-nanoparticle counting via photon-upconversion microscopy, serving as a reference method. The method is compatible with laser wavelengths (2940, 213, and partially 193-nm), providing robust TE evaluation in LA-SP-ICP-MS systems.
Experimental Section
ICP-MS Data Evaluation
Detailed information on the quadrupole and TOF ICP-MS setups, data acquisition and processing, including correction of coincidence of multiple NPs is available in the Supporting Information. The TE was calculated based on the ratio of the number of NPs detected by UCM and LA-SP-ICP-MS.
An ICP quadrupole mass spectrometer Agilent 7900 (Agilent Technologies, Santa Clara, CA) was combined with 2940, 213, and 193-nm laser ablation systems. The 193-nm laser ablation system was also coupled to the Vitesse ICP-TOF mass spectrometer (Nu Instruments, UK).
The 2940-nm laser ablation system was linked to the quadrupole ICP mass spectrometer through a 1.34-mm inner diameter stainless steel capillary transport tube (Swagelok, Solon, OH) via a low-volume laser ablation adapter from Glass Expansion (Port Melbourne, Australia) with a make-up gas Ar flow rate of 0.4 L/min to introduce the dry aerosol into the ICP. A quartz plasma torch with a 2.5-mm injector width (AHF analysentechnik AG, Tübingen, Germany) was employed to sustain a total gas flow rate of 2.0 L/min. The ICP-MS was operated in a time-resolved analysis mode with the shortest dwell time possible, 100 μs, to minimize errors from partial NP event integration and coincidental events. The isotope of choice detected within the NPs was 89Y, as it had the highest abundance. We used yttrium standard solution (Analytika, Prague, Czech Republic) diluted to 1 μg/L to adjust the position of the plasma torch and voltage of the ion optics and maximize the detector's response at the mass-to-charge ratio (m/z) 89.
For the 213-nm LA, the same MS setup was used as in the 2940-nm LA-ICP-MS, with a minor change to tubing and Ar flow rate. The connection between the ablation cell and the plasma torch was facilitated by a 2.5-mm inner diameter polyurethane tube (Parker Legris, Cleveland, OH), and the 1.1 L/min Ar make-up gas was introduced via a quick-connect.
For the 193-nm LA, the quadrupole system was connected to the laser using a Fluorinated Ethylene Propylene (FEP) tube with an inner diameter of 2 mm. Gas flow rates in the ablation cell were configured to match those used for the 213-nm laser ablation system. The quadrupole mass spectrometer settings were identical to those used for the 213-nm measurements. In the case of LA-ICP-TOFMS, the laser was coupled to the mass spectrometer via an aerosol rapid introduction system (ARIS) for aerosol transport. Parameters such as Ar flow, torch position, and TOF parameters were optimized daily to obtain the best sensitivity by ablating the NIST 612 "Trace Elements in Glass" reference material to maximize the response for 115In, 238U, and 89Y. Final measurements were conducted over a reduced mass range of 39–89 amu with a 76.89 μs dwell time.
Results and Discussion
Two approaches were examined to determine transport efficiency. In the “Random area” approach, square areas imaged by UCM and LA-SP-ICP-MS were chosen randomly on the same glass slide with the agarose layer. In the “Grid area” approach, an identical square area defined by the grid generated in the agarose layer was inspected by UCM and LA-SP-ICP-MS. Three lasers, with wavelengths of 2940, 213, and 193-nm, were used for ablation. Applicability of agarose as a standard for TE determination of soft tissues was confirmed by comparing numbers of NPs desorbed from agarose and mouse brain tissue sections. Details are available in the Supporting Information (Figure S2).
2940-nm LA-ICP-MSI
For imaging, a square in the grid-modified agarose layers was ablated by the IR system under conditions adjusted for imaging; the time between two consecutive laser pulses was set to ∼100 ms, above the ablation cell washout time of ∼75 ms, (19) to minimize the overflow of NPs into the following pixels. For 213-nm ablation, conditions remained the same as in the case of the random area approach.
Overlaying images with different lateral resolutions, shifts, and rotations with no distinctive features is not straightforward and was accomplished using a special algorithm, as detailed in Figure S6 of the Supporting Information. UCM and 2940-nm LA-SP-ICP-MS maps of a selected square area on the agarose layer are shown in Figure 1. While at the macroscopic level, the images show fine alignment, careful examination reveals an imperfect overlay of UCM-localized NPs with the ICP-MS map. This misalignment can be attributed to NP spillover into adjacent pixels, mostly due to mechanical limitations of the XY stage discussed previously. Another possible contribution may be the accumulation of material from the previous line on the edge of the next line; this is also seen on the square edges in Figure 1A. Nevertheless, the spillover of NPs into surrounding pixels does not affect the total number of detected NPs, only their spatial distribution; therefore, the agarose layers can still be used for accurate TE determination. The average detected NP counts for IR-LA and the calculated TE are in Table 1, NP counts from individual experiments can be found in the Supporting Information. By ablating a defined area with a precisely known number of NPs, we eliminated the effect of inhomogeneous NP dispersion in the gel and thus reduced the RSD’s of the method by 3% or 5% for 2940- or 213-nm laser ablation, respectively. The TE value was in excellent agreement with that determined by the random area approach.
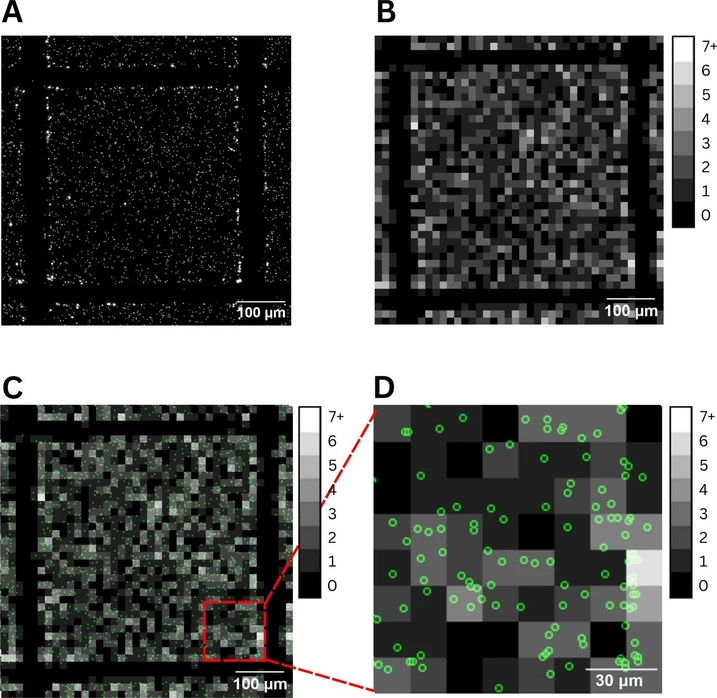 Anal. Chem. 2025, 97, 25, 12940–12946: Figure 1. 2940-nm LA-SP-ICP-MS and UCM image overlay. (A) UCM image, with bright spots indicating individual NP signals. (B) Digital map of NP distribution measured by 2940-nm LA-SP-ICP-MSI, displayed in grayscale. The shades of gray represent the precise number of NPs in the agarose layer, with a pixel size of 15 µm × 15 µm. (C) Overlay of images A and B, where NPs localized by UCM are highlighted as green circles. (D) A zoomed-in section of panel (C), providing a detailed look at the overlay.
Conclusion
This study presents a direct method for determining TE in LA-SP-ICP-MS. The TE is calculated from the numbers of NPs released from agarose layers, which were previously characterized by UCM. The agarose layers with a specific number of NPs can be prepared, characterized, and archived for future use as a storage-stable standard. This study provides valuable insights into the laser ablation of Y-based upconversion NPs, highlighting wavelength-specific influence on their integrity and transport. The observed differences in NP integrity and transport reflect the behavior of these particular NPs in the employed laser ablation systems and may not directly apply to other NP types and sizes.
With the 2940-nm laser, the method was robust and reliable, achieving near-quantitative NP desorption. Yet, reablation is advisible to confirm the proper adjustment of the laser ablation system. The TE for this wavelength was primarily determined by the design of the ablation cell and the efficiency of aerosol transport. The 213-nm laser, while effective, required careful optimization of fluence to mitigate incomplete desorption and possible NP redeposition, which introduced variability in TE measurements. In contrast, the 193-nm laser showed significant limitations due to NP disintegration, elevated baseline, and noise, leading to a reduced TE. A possible remedy to NP disintegration could be using a poly(methyl methacrylate) or poly(vinylpyrrolidone) matrix for NP immobilization, (22) probably due to stronger absorption at 193-nm. We also tested the application of a TOF instrument, which potentially could miss small particles due to its reduced duty cycle. However, for NP sizes used here, we could demonstrate comparable TEs. This might be interesting for future studies as LA-SP-ICP-TOFMS would allow significantly faster mapping and a multiplex analysis, which are critical factors for many biochemical and/or medical applications (e.g., imaging mass cytometry).
This work emphasizes tailoring TE assessment methods to the unique characteristics of each LA system. By addressing challenges such as particle loss and signal variability, this method lays foundations for improved NP characterization and LA imaging across diverse applications. Future research should focus on optimization of this approach for systems operating at shorter wavelengths, which are the most used in the ICP-MS applications nowadays. Additionally, strategies to minimize particle loss and improve signal processing will be crucial for optimizing TE and broadening the applicability of this method.