Mineral Phase-Resolved Quantification in LA-ICP-MS Imaging
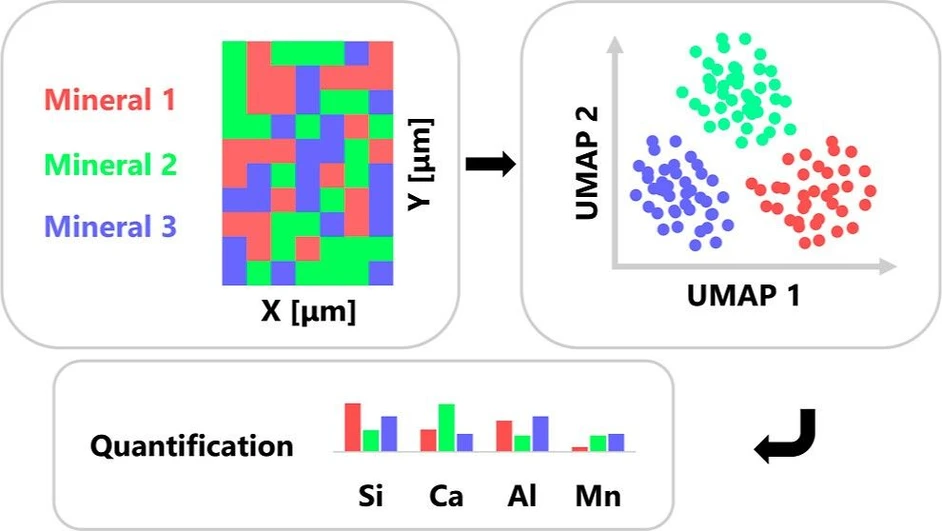
Anal. Chem. 2026, 98, 1, 581–589: Graphical abstract
LA-ICP-MS imaging, particularly in TOF mode, provides rapid, high-resolution elemental maps of complex geological materials, but quantitative accuracy is often limited by heterogeneous mineralogy. This study introduces a workflow using UMAP for unsupervised dimensionality reduction combined with k-means clustering to segment mineral phases directly from per-pixel elemental data.
Cluster compositions are matched to known minerals based on stoichiometry, allowing phase-specific normalization and reducing quantification errors by up to 60%. Validated on dawsonite-bearing sandstones, the approach enables consistent phase-resolved geochemical comparisons across depth profiles and establishes UMAP as a practical tool for accurate, interpretable multielement imaging.
The original article
Mineral Phase-Resolved Quantification in LA-ICP-MS Imaging
Barbara Umfahrer, Jakub Buday, Pavel Pořízka, Jozef Kaiser, Paolo S. Garofalo*, and Detlef Günther*
Anal. Chem. 2026, 98, 1, 581–589
https://doi.org/10.1021/acs.analchem.5c05398
licensed under CC-BY 4.0
Selected sections from the article follow. Formats and hyperlinks were adapted from the original.
Since its introduction in 1985, (1) Laser Ablation-Inductively Coupled Plasma-Mass Spectrometry (LA-ICP-MS) has matured into a routine technique for both qualitative and quantitative elemental analysis, finding use in diverse fields such as geology, (2−4) biology, (5,6) materials science, (7) and cultural heritage. (8,9) Especially in comparison to liquid analysis techniques, the method excels through minimal sample preparation, negligible sample destruction, and low limits of detection, which enable trace element analysis. However, besides the availability of standard reference materials, a longstanding challenge of quantitative LA-ICP-MS is the need for a suitable internal standard to account for variations in ablation rate and transport efficiency, as well as instrumental drift. (10) Developed for applications in geological matrices, this requirement was elegantly circumvented by Liu et al. (11) through 100 wt % normalization, which assumes that all detected elements form oxides summing up to 100 wt %. This approach was conceptually inspired by the summed-spectrum normalization calibration procedure introduced by Leach and Hieftje in 2000, which emphasized the use of total signal intensities for robust internal standardization. (12) The 100 wt % normalization strategy was subsequently extended to the bulk analysis of carbonates. (13)
Concurrently, the advent of time-of-flight (TOF) mass analyzers and the development of fast-washout laser ablation cells (14−16) have transformed LA-ICP-MS into a powerful imaging tool, capable of generating spatial maps across a variety of sample matrices at high data acquisition rates. (17−19) Furthermore, in comparison to, e.g., X-ray fluorescence spectroscopy (XRF) or Scanning Electron Microscopy with Energy-Dispersive X-ray Spectroscopy (SEM-EDS), LA-ICP-MS offers a high depth resolution of approximately 0.2 μm on glass, enabling precise measurement of fine-scale structures not only laterally but also in depth. (18) However, as the volume and complexity of these elemental images have grown according to the progressive advancement of the method itself, now consisting of gigabytes of data produced within minutes, manual data interpretation has become increasingly impractical. To uncover meaningful details and patterns, researchers have applied multivariate methods such as Principal Component Analysis (PCA) and k-means clustering to reduce dimensionality and delineate distinct regions within the images. (20−23) The nonlinear dimensionality reduction technique Uniform Manifold Approximation and Projection (UMAP), (24) which supports data interpretation with its capability to capture and separate subtle local structures, has first been employed to LA-ICP-MS bulk analysis data in 2024, where it was used to classify pyrite samples and discriminate between Pb and Zn deposit types. (25,26) In combination with elemental imaging, UMAP has recently been applied to biological tissue data sets as an exploratory analysis tool, (27) further enhancing the ability to visualize and interpret complex elemental distributions.
Despite these advances, no existing approach combines the unsupervised segmentation of mineral phases by UMAP with phase-specific normalization. In this study, we introduce a UMAP-driven workflow that (1) automatically segments distinct mineralogical phases within fine-grained geological matrices and (2) applies phase-specific 100 wt % normalization (e.g., oxide (11) or carbonate (13)), thereby improving quantification accuracy and enabling phase-specific quantitative interpretation of mineral distributions in complex matrices.
Materials and Methods
LA-ICP-TOFMS Imaging
LA-ICP-TOFMS analyses were performed using a 193 nm ArF excimer laser (GeoLas C, Lambda Physik, Göttingen, Germany) coupled to an ICP-TOFMS instrument (icpTOF 2R, TOFWERK AG, Thun, Switzerland). Ablation was conducted in the modified parallel flow ablation cell (MPFAC) (16,34) under a He atmosphere (99.999%, Linde Gas Schweiz AG, Dagmersellen, Switzerland) with Ar (99.996%, Linde Gas Schweiz AG) used as the carrier gas. A piezoelectrically driven xyz translational stage (1 nm resolution, SmarAct GmbH, Oldenburg, Germany) enabled precise sample positioning. Laser, stage movement, and ICP-TOFMS data acquisition were synchronized using a custom-built imaging control system. (19) The system was optimized each day based on maximum sensitivity while ensuring a 238U+/232Th+ intensity ratio of 1.0 to 1.1 on NIST SRM 610 and a 232Th16O+/232Th+ rate of below 0.5%.
LIBS Imaging
The LIBS analyses were performed on a Firefly system (Lightigo, Czech Republic). The laser (1064 nm, 5 mJ, pulse duration ∼10 ns, diameter 6 mm, operating at 50 Hz) was focused on the sample with a singlet lens (focal length 50 mm) to a 30 μm spot. The spatial resolution of the acquired elemental maps, with a size of about 16 mm × 26 mm, was 20 μm. Plasma radiation is collected by a multifiber configuration with a collimator and an optical fiber (400 μm core diameter), which delivered the light to several Czerny–Turner spectrometers (resolution 0.25–0.4 nm). The spectral range of the spectrometers is 180–850 nm. The radiation is collected 1.5 μs after ablation, with a gate width of 15 μs.
Data processing was done with Python 3.11.8 in the Spyder environment and included background correction and per-pixel z-score normalization.
Results and Discussion
LIBS and XRD Measurements
To assess whether carbonate-based normalization (13) is warranted, first, large-scale LIBS elemental intensity maps of the samples across about a third of the thin sections were acquired. Figure 1 reveals the results for “Layer 2” of the Poggio del Gatto sandstone for selected elements. A complete mapping of all four thin sections can be found in Figures S3 and S6 in the Supporting Information. The maps reveal that C is strongly enriched in fracture veins as well as in finer-grained domains within the matrix and correlates with Ca, indicating carbonate minerals rather than oxides. Bulk XRD analysis identifies calcite alongside quartz, plagioclase, white mica, and kaolinite. These complementary observations confirm calcite as a major phase and thus justify the need for performing the 100 wt % normalization on a carbonate basis for pixels representing calcite.
 Anal. Chem. 2026, 98, 1, 581–589: Figure 1. LIBS elemental intensity maps of the data set from “Layer 2” of the Poggio del Gatto sandstone mounted on a microscope slide, depicting calcite veins and fine-grained structures within the matrix, underlining the need for carbonate-based normalization for specific pixels. Emission lines for evaluation are shown in the corresponding subfigure title. The epoxy used to fix the thin section on the slide is visible along the margin.
Renormalization Based on Carbonates
Applying an oxide-based normalization to carbonate samples will introduce composition-dependent biases that cannot immediately be generalized as a singular numerical value. The difference between the molecular masses of carbonate CO32– and its oxide equivalent O2– yields an intrinsic bias on the order of a factor of about two, depending on the stoichiometry. Once this data is renormalized to a total of 100 wt %, the magnitude of the error becomes highly dependent on the specific elemental composition of the sample. An exemplary calculation illustrating this effect for a representative calcite pixel is provided in Table S2, yielding a relative error of 79%. In practice, this error varies across the image according to the local phase composition. Figure 6 illustrates the impact of normalization approaches for layer 2 of the samples as well as the spatial distribution of the resulting relative error. The figure presents Ca and Si elemental maps in two rows, while the first three columns compare different normalization strategies: normalization based on all oxides, normalization based on all carbonates, and a pixel-wise normalization guided by mineral phase identification, as outlined in the workflow proposed in this study. The final column displays the relative error between the bulk oxide- or carbonate-based normalization and the pixel-wise, phase-informed normalization.
 Anal. Chem. 2026, 98, 1, 581–589: Figure 6. Comparison of normalization strategies for Ca and Si LA-ICP-TOFMS elemental maps in “Layer 2” of the Poggio del Gatto sandstone. Rows show Ca (top) and Si (bottom); columns compare (1) oxide-based normalization, (2) carbonate-based normalization, (3) pixel-wise, phase-informed normalization (this study), and (4) relative error between the first two and the phase-informed approach.
For Ca (in this matrix primarily associated with calcite, a dominant carbonate phase in our samples), the relative error depicted quantifies the effect of applying oxide-based normalization across the entire image. This results in a systematic overestimation of the Ca concentration by approximately 60%. Conversely, for Si─in this matrix found mainly in quartz and various plagioclase phases─the error is shown for applying carbonate-based normalization across an oxidic matrix. In such cases, the Si concentrations are underestimated by roughly 10% to 40%, depending on the mineral phase.
These findings highlight that using a single normalization scheme across heterogeneous samples introduces substantial quantification errors. To mitigate this, the pixel-wise phase segmentation enabled by the proposed UMAP-based workflow offers a significant advantage, especially in fine-grained matrices. In short, phase-aware, pixel-wise normalization combines the strengths of both normalization approaches and proves to be highly beneficial.
Conclusion
This study demonstrates that phase-specific normalization, guided by unsupervised phase segmentation of LA-ICP-MS images, can substantially improve the accuracy of elemental quantification in fine-grained geological matrices. Rather than relying on a single global assumption (e.g., all oxides or all carbonates), the workflow adapts normalization to the actual mineralogy, minimizing systematic errors and enabling phase-resolved geochemical interpretation.
The segmentation step, based on UMAP embedding and k-means clustering, is fully unsupervised. However, the subsequent matching of clusters to specific minerals still relies on a limited set of preidentified stoichiometries and is therefore not yet fully unsupervised. Expansion to larger stoichiometric databases could help overcome this limitation and move toward automated mineral classification. A key challenge remains the similarity of cation ratios in certain mineral groups, which may still require complementary data to ensure robust assignments.
Overall, beyond the specific case of the Poggio del Gatto sandstone presented in this study, this work provides a framework for quantitative elemental imaging of complex geological samples and is readily transferable to other contexts that require spatially resolved composition-aware normalization. This contribution adds a practical implementation to a growing literature that already uses multivariate statistics to unlock the immense information depth of LA-ICP-TOFMS.