Quantitative Analysis of Target–ligand interactions by CSP NMR titrations
A powerful tool that automatically processes 1D and 2D NMR Target-ligand titration spectra, tracks peaks movement, generates the binding curves and calculates values for 1:1 complexes. For a more sophisticated analysis, the binding curves are directly exported to the 3rd party software AFFINImeter, allowing global analysis to a variety of binding models.
Benefits:
- Intuitive workflow that allows you to analyze CSP titration experiments interactively or fully automatically.
- Automatic peak tracking, binding curve generation and fitting to compute dissociation constant (Kd) of 1:1 complexes.
- Easy exporting of binding curves to the 3rd party software AFFINImeter for advanced analyses, e.g, global analysis of a set of titration curves and availability of a variety of binding models.
Features:
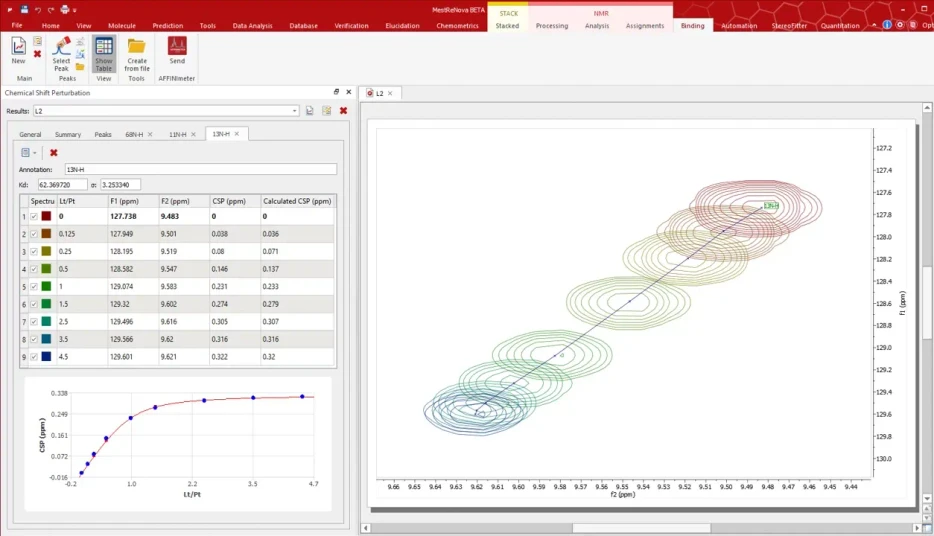
Automated peak tracking and binding curve generation
Automated peak tracking across the titration spectra, with manual refinement also available.
The figure shows an example of a peak tracked with its corresponding CSP values and the resulting binding curve, demonstrating the accuracy and efficiency of the automated process in analyzing binding interactions.
 Mestrelab Research: Mnova Binding - Automated peak tracking and binding curve generation
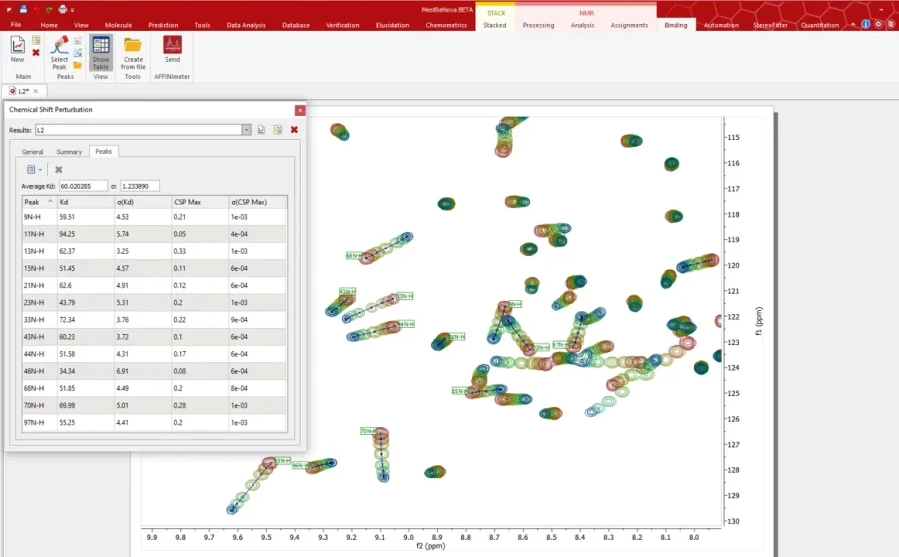
Automated individual/average Kd calculation
Automated calculation of the dissociation constant (Kd) for each tracked peak is performed upon generation of the binding curve. This feature also includes the automatic calculation of the average Kd from the set of individual Kd values calculated for each peak.
This process streamlines the determination of binding affinities, ensuring accurate and consistent results while saving valuable time for researchers.
 Mestrelab Research: Mnova Binding - Automated individual-average Kd calculation
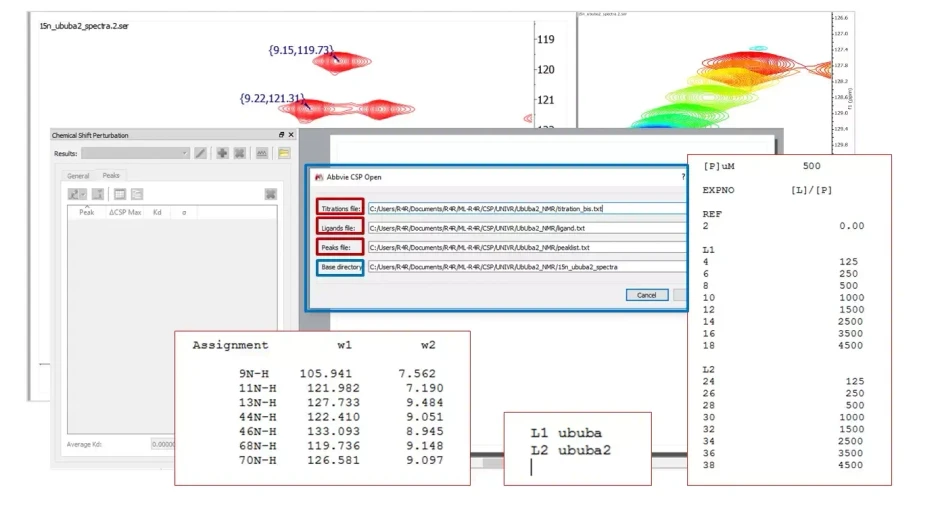
Fully automated analysis
A series of titrations can be specified simply by listing them sequentially in the “titration file.” The names for the ligands used are coded in the “ligands file.” When CSP runs the analysis automatically, it creates different Mnova files for each titration listed in the “titration file,” and the Mnova documents are named according to the ligands’ names.
This feature ensures a seamless and efficient workflow, eliminating manual input and reducing errors, thus enhancing the overall productivity of the analysis process.
 Mestrelab Research: Mnova Binding - Fully automated analysis


