Co-Evolution of Volatiles and Pyrolytic Residue during Lignin Pyrolysis

ACS Omega 2026, 11, 2, 2800–2809: Graphical abstract
To address gaps in understanding stage-specific volatile evolution during lignin slow pyrolysis, this study developed a modified Py-GC/MS method enabling in situ capture of volatiles at defined temperature stages. Combined with TG-FTIR, CP/MAS NMR, and kinetic analysis, the co-evolution of volatiles and pyrolytic residues was systematically investigated.
Results show that increasing temperature (150–750 °C) promotes progressive α- and β-ether bond cleavage, side-chain C–C bond scission, and repolymerization. Volatile formation is mainly driven by side-chain cleavage, with functional groups evolving from unsaturated moieties to methyl groups or being eliminated. Activation energy analysis indicates that α- and β-ether bond homolysis is the most energetically favorable pathway, explaining the observed compositional shifts across pyrolysis stages.
The original article
Co-Evolution of Volatiles and Pyrolytic Residue during Lignin Pyrolysis
Hao Ma, Yingzheng Li, Huixia Zhu, Xingxiang Ji*, Shubin Wu, and Zhongjian Tian
ACS Omega 2026, 11, 2, 2800–2809
https://doi.org/10.1021/acsomega.5c08593
licensed under CC-BY 4.0
Selected sections from the article follow. Formats and hyperlinks were adapted from the original.
Lignin is the second most abundant component after cellulose in lignocellulosic biomass, (1) and it contains approximately 40% of the energy in lignocellulosic biomass. (2) Lignin is the most abundant renewable source of aromatics, far surpassing other biomass-derived aromatics such as tannins. (3) Among various methods used for high-value usage of lignin, pyrolysis is the most promising and economic technology. (4,5) The complex linkages (C–C and ether linkages) and various functional groups (methoxy group and phenolic hydroxyl groups) in lignin significantly affect the pyrolysis of lignin. (6,7) Thus, compounds derived through pyrolysis suffer from limitations, including low yield and poor selectivity. (8)
Numerous studies have attempted to improve the undesirable properties of pyrolysis products while focusing on process optimization, catalyst development, and lignin depolymerization mechanisms. (9−11) However, lignin pyrolysis is a complex reaction, which is not completely understood owing to the complex structure of the lignin and limitations of the detection methods. (12,13) Many researchers have explored the evolution of the lignin structure and pyrolysis mechanism during the pyrolysis process by studying the products of lignin pyrolysis. However, most of these studies focus on a specific product to investigate the evolution mechanism of lignin. Du et al. (14) investigated the effect of hydroxypropyl modification of lignin on its pyrolysis by analyzing the liquid phase products. However, their study does not fully elucidate the concurrent changes in the char structure or gas evolution. In contrast, studies focusing on solid-phase transformations, such as the kinetic modeling conducted by Zhu and Du, (15) or gas-phase analysis performed by Li et al. (16) to examine cellulose–lignin interactions, provide valuable insights into these respective phases but lack direct correlation with the evolution of valuable liquid intermediates. By examination of the evolution of products during the pyrolysis process, the lignin pyrolysis mechanism can be effectively elucidated. A collaborative exploration of the transformation of gaseous, solid, and liquid products throughout the lignin pyrolysis process would further enhance the comprehension of its intricate pyrolysis evolution mechanism.
There are many analytical techniques to detect the evolution of lignin during pyrolysis. The thermogravimetric analyzer (TGA) is capable of detecting the weight variations of substances throughout the pyrolysis process. TGA is usually coupled with other techniques to detect the evolution of the lignin’s chemical structure during pyrolysis. TG-FTIR and TG-MS are mainly used to detect the evolution of H2O, CH4, CO2, and CO in the pyrolysis products. (17,18) The identification of bio-oil is usually conducted by using pyrolysis-gas chromatography mass spectrometry (Py-GCMS). (19,20) Therefore, researchers often use a combination of TG-FTIR and Py-GCMS to explore the evolution of released products in pyrolysis reactions. (21) For example, Cai et al. (22) studied the pyrolytic products of waste tea using Py-GCMS, and Liang et al. (23) used Py-GCMS to analyze the pyrolysis characteristics of moso bamboo. However, the evolution of the bio-oil produced during slow pyrolysis of lignin with Py-GCMS cannot be detected because the working mode of the GC system comprises one injection, and pyrolysis volatiles are continuously produced during slow pyrolysis. The volatiles that can be detected by Py-GCMS are usually produced via fast pyrolysis and are the final products of pyrolysis. The products of slow pyrolysis differ from those of fast pyrolysis owing to varying heating rates. (24) Therefore, when TG-FTIR is used along with Py-GCMS to analyze the evolution of noncondensable gas and bio-oil during slow pyrolysis, experimental results are biased because of the different reaction conditions. Thus, a knowledge gap prevails in the related literature regarding the synergistic evolution of gas, solid, and liquid three-phase products during lignin pyrolysis at the same heating rate.
To avoid experimental deviations caused by different pyrolysis conditions and explore the evolution of bio-oil during lignin pyrolysis, this study introduced a modified Py-GCMS that enables the detection of volatiles produced in different stages of lignin pyrolysis. The Py-GCMS inlet line was modified to allow the accumulation of the pyrolysis gas generated by Py-GCMS in the pyrolysis furnace instead of directly entering GC-MS. Based on this method, the evolution of bio-oil was investigated during lignin pyrolysis. Furthermore, the evolution of pyrolysis gas and pyrolytic residue during pyrolysis was explored using TG-FTIR, FTIR, and CP/MAS NMR to elucidate the evolution mechanism of volatiles. Mass loss and activation energy (Ea) of lignin pyrolysis were detected by using TGA. Thus, lignin pyrolysis was better understood through a comprehensive study of the coevolution of volatiles and pyrolytic residue.
2. Materials and Methods
2.2. Py-GCMS Analysis
Analytical Py-GCMS experiments were conducted by using a pyrolysis furnace (Tandemu-Reactor Rx-3050TR) connected to an Agilent 7890B gas chromatograph and 5975C mass spectrometer detector. Helium gas (99.99%) was used as the carrier gas at a flow rate of 1 mL/min. Pyrolytic vapors were directly analyzed by using GCMS with a TR-5MS capillary column (30 m × 0.25 mm i.d., 0.25-μm-thick film) in a split mode of 30:1. The GC front inlet temperature was maintained at 300 °C, and the temperature of the GC column was initially set to 40 °C for 2 min; then, the temperature was first increased to 120 °C at 20 °C/min, then 170 °C at 4 °C/min, and finally 300 °C at 20 °C/min. The mass spectrometer was operated at 70 eV in the EI mode. All pyrolytic products were identified by using the NIST library of mass spectra. (17)
To investigate the distribution of volatiles at varying temperatures during the slow pyrolysis of lignin, the pyrolysis furnace was modified; a schematic of Py-GCMS is shown in Figure 1. An air inlet pipe was connected to the air inlet of the original Py-GCMS. With this modification, the gas produced during the slow pyrolysis of lignin can accumulate in the pyrolysis furnace. The carrier gas can enter Py-GCMS from the original air inlet, thus enabling Py-GCMS to continue to function. When the carrier gas entered the GC-MS system from the air inlet above the pyrolysis furnace, the pyrolysis gas accumulated in the pyrolysis furnace and was brought into the GC-MS system for detection.
 ACS Omega 2026, 11, 2, 2800–2809: Figure 1. Schematic of Py-GCMS ((a) original Py-GCMS, (b) modified Py-GCMS).
2.4. Determination of Thermogravimetric Characteristics
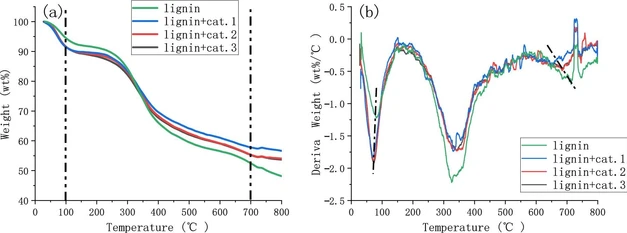
The thermogravimetric characteristics of lignin were observed in terms of global mass loss using a TA Instruments TGA Q500 TGA (TA Instruments, USA) in a nitrogen atmosphere. TGA was conducted up to 700 °C with different heating rates. For the TGA experiment, approximately 5–8 mg of lignin was evenly and loosely distributed in an open pan; N2 gas flowed at 25 mL/min, and the TGA oven temperature was maintained at 378 K (105 °C) for 15 min to remove water from lignin.
2.6. Thermogravimetric Infrared Analysis
The FTIR spectra of the products of coniferous lignin were measured by a Tensor27 thermogravimetric spectrometer of Bruker and a Netzsch STA499C Fourier transform infrared spectrometer. The pyrolysis gas outlet of the TGA is connected with the gas pool of the infrared spectrometer equipped with the MCT detector through the heating duct so that the gas generated by the pyrolysis of lignin can be directly detected in the infrared spectrometer, and the infrared spectrum of the pyrolysis gas can be tracked in real time using the time-resolved software. At the same time, in order to reduce the noise of the detection signal, liquid nitrogen was used to cool the MCT detector during the experiment.
The TGA was used in DTA-TG mode, during which the pyrolysis furnace temperature was ramped up from 100 to 750 °C at a ramp rate of 4 °C/min. High-purity nitrogen was used as a protective gas at a flow rate of 60 mL/min, and the temperature of the gas transmission line between the TGA and the infrared spectrometer was 200 °C.
The wavelength scanning range of the FTIR spectrometer is 4000–650 cm–1, and the scanning speed is 2 times/s.
3. Results and Discussion
3.1. Evolution of Volatiles during Lignin Pyrolysis at Varying Temperatures
To track the evolution of volatiles during slow pyrolysis of lignin, the modified Py-GCMS system was used to investigate the distribution of volatiles over varying temperature ranges; the complete ion chromatograms are shown in Figure S1, and the relative proportions of the main compounds identified in the pyrolytic volatiles, as determined based on the areas of peaks in the corresponding chromatograms, are listed in Table S2. It can be observed from the diagram that, prior to 150 °C, almost no volatile products are produced during lignin pyrolysis, with the main volatile stage of pyrolysis products occurring between 250 and 450 °C. From the table, it is evident that lignin pyrolysis products include both low-molecular-weight monocyclic aromatic compounds, such as phenol and guaiacol, and polycyclic aromatic compounds, such as naphthalene. Besides variations in phenolic hydroxyl and methoxy groups, the primary difference among monocyclic aromatic compounds lies in the functional groups attached to the benzene ring.
To better analyze the composition of volatiles, each component was classified as naphthalenes, catechols, methoxyphenols, arylphenols, and phenols, as shown in Figure 2a. Methoxyphenols were the only products detected in the pyrolysis stage of 150–250 °C, and a very small amount of catechols and phenols was found in products at 250–350 °C. Furthermore, the proportion of catechols notably increased at 350–550 °C, and the arylphenols and phenols were the main components of volatiles at 550–650 °C. This contrasts sharply with typical fast pyrolysis studies, (26) where methoxyphenols often remain the dominant product, even at higher temperatures. The results suggest that the longer residence time in slow pyrolysis provides a greater opportunity for secondary reactions, such as demethoxylation to catechols and subsequent dehydroxylation to phenols, (27) to occur to a much greater extent. This highlights a fundamental difference in product evolution, which is governed by the heating rate and residence time. Therefore, the methoxy group of lignin began to react below 350 °C and was mainly converted to a hydroxyl group via homolysis at a lower temperature; it was converted into methyl or was removed through rearrangement at a higher temperature. These results are consistent with those obtained in a previous report. (28) As the pyrolysis temperature continued to increase, the proportion of monocyclic aromatic compounds gradually decreased. Naphthalenes were detected in the pyrolysis stage at 450–550 °C and increased with temperature, indicating the formation of polycyclic aromatic hydrocarbons (PAHs), such as naphthalene, by coupling reactions below 550 °C, (29) and it was promoted by increasing the temperature.
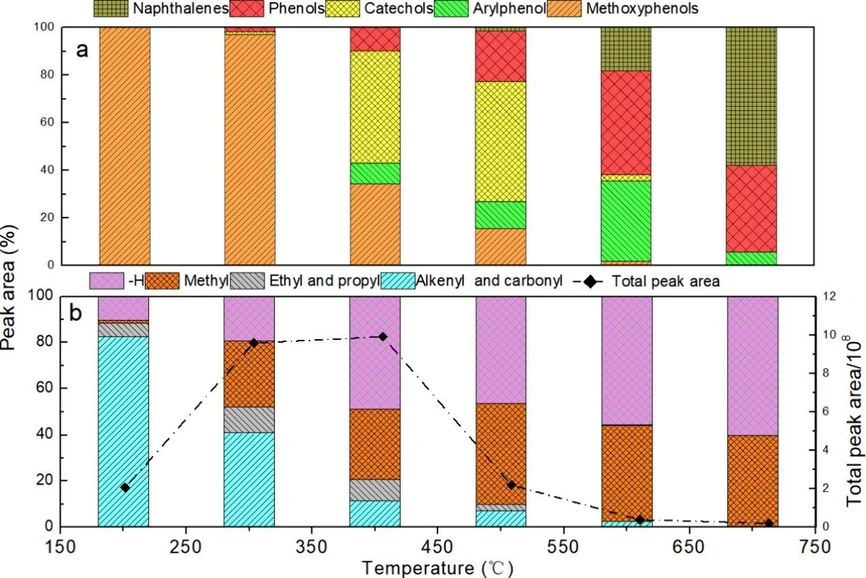 ACS Omega 2026, 11, 2, 2800–2809: Figure 2. Product distribution (a), side chain (at the para position of phenolic hydroxyl) structure of the benzene ring, and the total peak area (b) during lignin pyrolysis at varying temperatures.
The side chain (at the para position of phenolic hydroxyl) of lignin also reacted during pyrolysis; the side-chain structure of the monocyclic aromatic compounds from lignin pyrolysis is shown in Figure 2b. The number of functional groups in the side chain is considered to be equal to the total number of compounds containing this functional group in the side chain. The products with unsaturated bonds (alkenyl and ketone) were the dominant products at 150–250 °C, which noticeably decreased with increasing temperature. The products with ethyl and propyl slightly increased at 250–450 °C and disappeared at temperatures above 550 °C. As the temperature increased, the products with methyl and no substituent at the para position of phenolic hydroxyl were enhanced, i.e., up to 80% at 350–450 °C, indicating that mainly unsaturated bonds and ethyl and propyl groups were cleaved at 250–450 °C. The observed shift in side-chain structure from unsaturated groups to methyl groups is consistent with the findings of Yang et al., (30) who reported that C–O–C and C–C bond cleavages are the dominant reactions in the 250–450 °C range. Data from the stagewise analysis further refine this viewpoint, demonstrating that longer-chain side chains are cleaved at lower temperatures, while methyl-substituted phenols are volatilized at higher temperatures.
3.2. Structural Characteristics of Pyrolysis Residues Obtained during Lignin Pyrolysis
To better elucidate the coevolution mechanism of volatiles and pyrolytic residue, the pyrolytic residue produced during lignin pyrolysis at varying temperatures was evaluated by using FTIR and 13C CP/MAS NMR. Figure 4 presents the FTIR spectra of the pyrolytic residues. The spectrum of the 150 °C sample closely resembles that of the raw lignin, indicating a minimal structural change at this temperature. As the pyrolysis temperature increased, significant transformations in the lignin structure became evident. Specifically, the characteristic band for aromatic skeletal vibrations in G-units at 1510 cm–1 decreased in intensity at 250 °C and vanished at 450 °C. Similarly, the absorption peaks at 1220 and 1270 cm–1, characteristic of the C–O stretching vibrations in G-type structures and ether bonds, also attenuated significantly at 450 °C, eventually disappearing completely. (34) The diminishment of these signals suggests a profound alteration of the lignin’s aromatic and C–O bond-containing structures. As will be demonstrated by subsequent 13C NMR analysis, this trend strongly correlates with the cleavage of key ether bonds (e.g., β-O-4), which forms the basis of lignin depolymerization. The bands at 1711 and 1033 cm–1 confirmed the presence of carbonyl and alcohol hydroxyl groups, (35) both of which were on the side chain of lignin; they began to significantly reduce at 250 °C and disappeared at 450 °C, which further suggests that the side-chain breakage of lignin mainly occurred between 250 and 450 °C. The wide band (3426 and 2954 cm–1) for hydroxyl (−OH) and methyl groups decreased when the pyrolysis temperature increased to 750 °C, demonstrating that depolymerization and charring of arylphenol occurred during lignin pyrolysis; the two functional groups were still present at 750 °C.
 ACS Omega 2026, 11, 2, 2800–2809: Figure 4. FTIR spectra of residue produced during lignin pyrolysis at varying temperatures.
4. Conclusions
The modified Py-GCMS can appropriately detect the evolution of volatiles during lignin pyrolysis. The yield and composition of volatiles produced over varying temperature ranges were different in the lignin pyrolysis process. With increasing temperature, the main components of volatiles were methoxyphenols at 150–350 °C, catechols at 350–550 °C, arylphenols and phenols at 550–650 °C, and naphthalenes at 650–750 °C. The side chain of the benzene ring gradually changed from unsaturated alkyl to methyl or was removed as the temperature increased. Methoxy groups mainly underwent a homolysis reaction at a lower temperature and a rearrangement reaction at a higher temperature. Conclusively, the following pattern of Ea was observed: Ea of α- and β-ether bond homolysis < Ea of side-chain C–C bond homolysis < Ea of the repolymerization reaction and Ea of methoxy group homolysis < Ea of methoxy group rearrangement. This study demonstrates that processing can be designed to target specific compounds and provides a guide for the high-value usage of lignin.