ATR-FTIR Microspectroscopy as a Tool for Distinguishing Wine-Relevant Saccharomyces spp. Strains Based on Their Autolytic Behavior
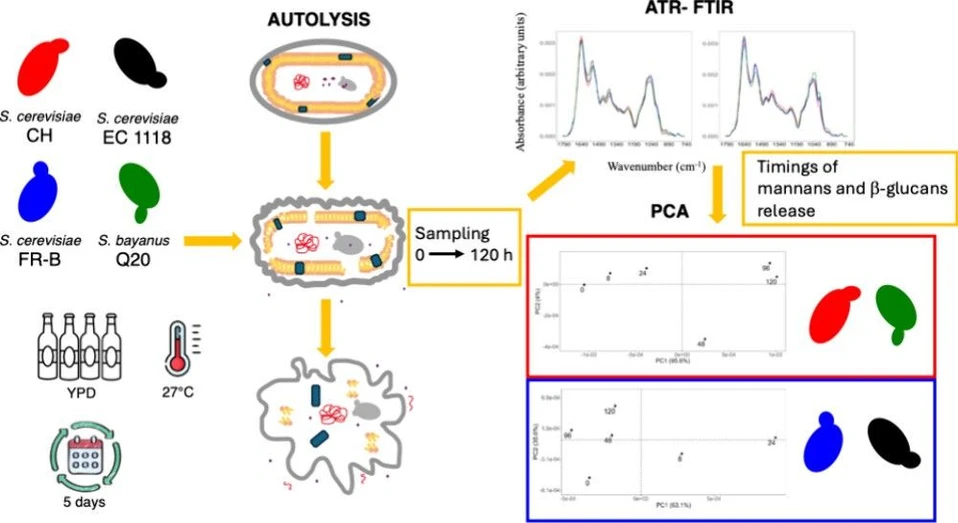
ACS Food Sci. Technol. 2025, 5, 4, 1625–1631: Graphical abstract
Yeast autolysis influences both wine composition and sensory properties, particularly when lees contact is encouraged. This study applied ATR-FTIR microspectroscopy with multivariate analysis to monitor autolytic processes in several Saccharomyces strains.
The technique successfully distinguished S. cerevisiae EC 1118 and FR-B from CH, as well as S. bayanus Q20, based on autolysis kinetics involving mannans and β-glucans. ATR-FTIR thus shows strong potential as a screening tool for selecting starter cultures with desirable autolytic traits in winemaking and broader biotechnological applications.
The original article
ATR-FTIR Microspectroscopy as a Tool for Distinguishing Wine-Relevant Saccharomyces spp. Strains Based on Their Autolytic Behavior
Renato L. Binati, Nicola Ferremi Leali, Elisa Salvetti, Francesca Monti*, and Sandra Torriani
ACS Food Sci. Technol. 2025, 5, 4, 1625–1631
https://doi.org/10.1021/acsfoodscitech.5c00022
licensed under CC-BY 4.0
Selected sections from the article follow. Formats and hyperlinks were adapted from the original.
Autolysis is an irreversible phenomenon occurring in yeast cells, associated with cell death at the end of the stationary phase of growth. Several intracellular enzymes are activated to carry out a cascade of reactions to degrade internal and external cell structures with subsequent release of the hydrolysis products into the surrounding medium. Although the autolytic process occurs naturally, in many industrial contexts it can be induced to achieve a faster conclusion of the degradation reactions leading to the production of yeast extracts. In the wine industry, natural autolysis is especially important for the production of wines with prolonged aging on dead yeast lees (e.g., Champagne, Muscadet), notably sparkling wines, but yeast autolysates obtained from induced autolysis are added to different wine styles to achieve flavor enhancements. (1,2)
Appealing yeast cell wall components for winemaking include proteins, peptides, and polysaccharides. The external structure of yeast cells is made of a network of mannoproteins, β-glucans, and chitin. Glucanases and proteases are the main autolytic enzymes involved in cell wall hydrolysis: glucanases hydrolyze the bonded glucans and mannoproteins, which are degraded later onto the protein and polysaccharide fractions by proteolysis. Subsequently, the breakdown of these components and the increased porosity of the cell wall facilitate the release of other cellular compounds, including lipids from plasma membrane degradation, as well as amino acids and ribonucleotides. (1,3,4)
Fourier-transform infrared (FTIR) microspectroscopy offers a reliable method for evaluating the autolysis capacity of new or established yeast starters. (5) This nondestructive technique allows for the collection of strain-specific absorbance spectra of microbial samples, requiring neither reagents nor extensive sample preparation. Band positions and intensities are interpreted as related to known biochemical functional groups and molecular bonds─such as those of proteins, lipids, carbohydrates, and nucleic acids─providing both qualitative and quantitative insights into the chemical composition of the samples. (6,7)
The analysis of yeast autolytic behavior in a defined growth medium, such as YPD (yeast, dextrose, peptone), using FTIR spectroscopy serves as an excellent screening tool for selecting strains for further in-depth evaluation in wine or wine model systems. (8) Moreover, it enables precise detection of oenologically significant molecules, such as mannans and glucans, facilitating their potential purification for various applications. (9)
In oenological research, FTIR spectroscopy has been more commonly applied for the inter- and intraspecific discrimination of yeasts from Saccharomyces and non-Saccharomyces species. (10−13) In one of the first studies, (14) FTIR spectroscopy has been successfully utilized to discriminate strains belonging to Saccharomyces cerevisiae, the most important wine yeast, and the closely related Saccharomyces bayanus. Other investigations targeted cell modifications and growth-dependent phenomena, including biochemical stress responses to dehydration (15,16) and biofilm-forming capacity. (8) Previous studies have demonstrated that FTIR microspectroscopy is an effective tool for investigating the biochemical composition of yeast cells and analyzing structural changes associated with autolysis in S. cerevisiae EC 1118, a widely used industrial strain and a reference standard for sparkling wine production. (17,18) Recently, (19) FTIR spectroscopy was employed to compare the structure of yeast’s mannans extracted through different methods, such as thermal hydrolysis and enzymatic hydrolysis, including autolysis.
The objective of this study was to apply mid-infrared FTIR microspectroscopy in conjunction with multivariate statistical analysis to investigate the cell wall biochemical composition of Saccharomyces spp. strains during incubation in a defined growth medium. The ultimate goal is to set up a procedure aimed at distinguishing between yeast strains, providing insight into their autolytic behavior; this will allow for the proper selection of the most promising strains to be used in biotechnological applications.
2. Materials and Methods
2.3. FTIR Microspectroscopy
The cell pellets were resuspended in 500 μL of sterile water, and a 10 μL spot of each cellular suspension was deposited, in duplicate, on steel slides, which were previously washed with ultrapure water and ethanol 70% v/v. To dry the droplets, all slides were maintained under ventilation for 24 h, at 40 °C.
Mid-infrared absorption spectra were collected in the 1800–700 cm–1 range in the Attenuated Total Reflection (ATR) mode using a Vertex 70 Bruker Optics spectrometer coupled to a Hyperion 3000 vis/IR microscope (Bruker Optics, Germany). The system was equipped with a photoconductive MCT detector and a germanium ATR objective. The ATR mode has an enhanced sensitivity to the biochemical composition of the cell wall due to the reduced penetration depth of the infrared beam inside the sample, determined by the refractive indices of both the objective and the sample, that can be estimated to be around 400 nm at 1800 cm–1 up to 800 nm at 900 cm–1 in the present configuration. This depth, slightly increasing with the wavelength, is greater than the thickness of the cell wall but lower than the total thickness of the cell. (5) For each sample, i.e., for each time point, about 10 point-by-point spectra were acquired as the ratio of the transmitted to the incident photon intensity by coadding 256 scans at 4 cm–1 (108 s of acquisition time) from a 50 μm × 50 μm area.
2.4. Data Analysis
The software Opus 6.0 (Bruker Optics) was used for spectra pretreatment, including ATR and baseline correction, average spectra calculation, area normalization, and second derivative calculation to identify the main absorption bands. Principal Component Analysis (PCA) was performed using the statistical packages of the R software version 4.3.1. (22)
3. Results and Discussion
To compare the biochemical characteristics of the studied Saccharomyces spp. strains at the beginning of incubation (day 0) and at the end of the autolytic process (day 5), the corresponding area normalized average absorption spectra are shown in Figure 1 in the 1800–740 cm–1 range. Since the most meaningful differences among the strains are observed in the 1200–930 cm–1 range, as expected from previous studies on different strains, (5) the absorption spectra before autolysis and after 5 days of autolysis after baseline correction in this restricted range are also shown, enlarged, in Figure 2.
Table 1 reports the most meaningful absorption bands, as identified through the second derivative on the average absorption spectra (Figure 3), and their corresponding assignments.
 ACS Food Sci. Technol. 2025, 5, 4, 1625–1631: Figure 3. Second derivative plot of the FTIR spectra in the range 1200–930 cm–1 at 0 (left) and 120 h (right) for S. cerevisiae EC 1118 (black), CH (red), FR-B (blue), and S. bayanus Q20 (green).
In ATR spectra, due to the limited infrared beam penetration depth inside the sample, the detected composition on each strain reflects the interplay between the relative concentrations of the various biochemical components within the entire cell and the relative thickness of the cell wall. Notably, in the 1200–930 cm–1 range, most relevant biochemical components (5) are primarily associated with the cell wall, except for the phosphate band at 1080 cm–1, which is mainly related to intracellular nucleic acids and membrane phospholipids.
The behavior of second derivative spectra (Figure 3) at day 0 and after autolysis at day 5 highlights that the absorption bands that better discriminate the four spectra are those at 1050 cm–1 (mannans), 1030 cm–1 (β-1-4 glucans) and 995 cm–1 (β-1-6 glucans).
At day 0, the contribution of the band at 1050 cm–1 is either higher than or approximately equal to the band at 1030 cm–1 in CH and FR-B, respectively, whereas the opposite behavior is observed in EC 1118 and Q20, where the contribution of the 1030 cm–1 band is higher than that at 1050 cm–1. Conversely, the band at 995 cm–1 is more intense in EC 1118 and FR-B, while it is lower in CH and Q20. The band at 1080 cm–1 exhibits a similar intensity across all strains.
After 5 days, the behavior of the 1080 cm–1 band differs among the four strains. The 1050 cm–1 band has the same intensity in all of the strains, while the 1030 cm–1 band increases and tends to be more intense than the 1050 cm–1 band, with the lowest intensity again observed in CH as compared to the other strains. The 995 cm–1 band increases in intensity in all of the strains relative to day 0, but it remains notably lower in CH as compared to the other strains.
To better highlight the effect of autolysis on each strain, absorption spectra at day 0 and at day 5 are compared strain by strain in Figure 4.
 ACS Food Sci. Technol. 2025, 5, 4, 1625–1631: Figure 4. Area normalized average absorption spectra after baseline correction in the restricted range 1200–930 cm–1 at day 0 (red) and day 5 (black) for S. cerevisiae CH (a), S. bayanus Q20 (b), S. cerevisiae EC 1118 (c), and S. cerevisiae FR-B (d).
These results confirmed that the autolytic behavior and associated biochemical processes are strain-dependent, leading to the formation of two distinct strain clusters. In terms of temporal trends, CH and Q20 exhibited slower transitions, whereas EC 1118 showed the fastest evolution, followed by FR-B. Regarding biochemical modifications associated with cell lysis, EC 1118 displayed greater similarity to Q20, particularly in the degradation of β-1,6 glucans. Overall, this FTIR-based method proved to be an effective tool for distinguishing between yeast strains, enabling the screening of starters for wine styles in which yeast autolysis is a key factor in determining wine quality.
In the future, this valuable method could also be applied to evaluate the autolytic behavior of non-Saccharomyces yeast strains that are increasingly used in winemaking to differentiate the sensory profile of wine.