Rapid Identification of Hydrogen Isotopes in Water Mixtures by FTIR Spectroscopy
ACS Omega 2025, 10, 24, 25801–25809: Graphical abstract
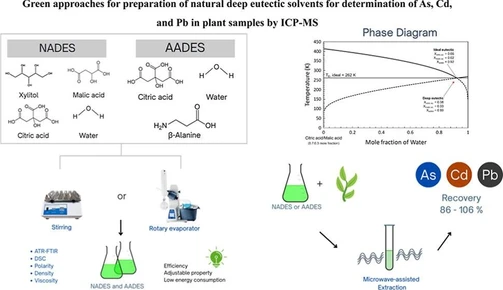
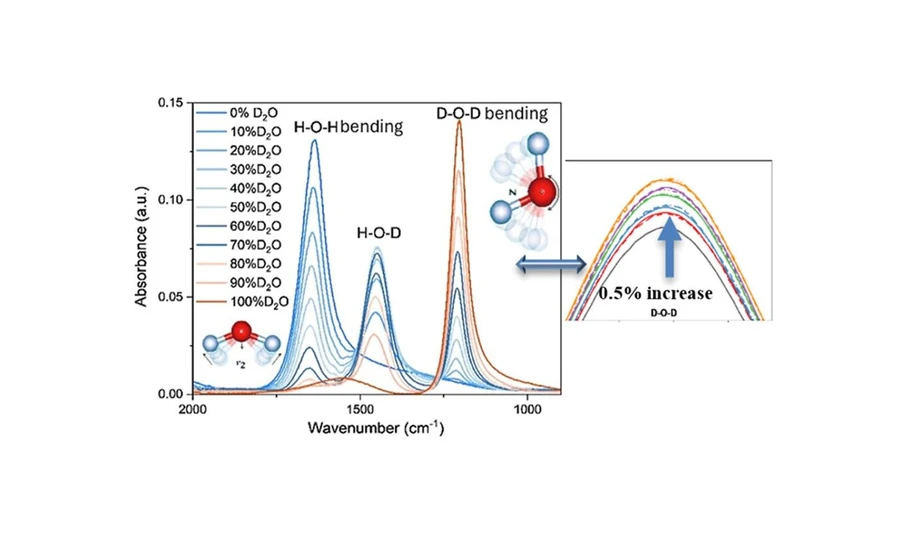
A method for fast determination of hydrogen isotope ratios in aqueous solutions was developed using Fourier transform infrared (FTIR) spectroscopy. By analyzing the bending vibrations of water molecules, isotopic mixtures of H2O and D2O (0–100% D2O) were examined under various conditions to evaluate stability, repeatability, and accuracy.
The results showed strong agreement with simulated equilibrium constants (average deviation ~1%) when accounting for HDO formation. The high sensitivity of molecular bending vibrations (~0.5%) confirmed FTIR spectroscopy as a reliable, rapid assay technique for distinguishing isotopic variations in water, offering an accurate approach for assessing hydrogen isotope composition.
The original article
Rapid Identification of Hydrogen Isotopes in Water Mixtures by FTIR Spectroscopy
Dankun Yang, Norbert Wegrzynowski, Alicja Szczepanska, David Oliver, Keith R. Hallam, and Thomas B. Scott*
ACS Omega 2025, 10, 24, 25801–25809
https://doi.org/10.1021/acsomega.5c01180
licensed under CC-BY 4.0
Selected sections from the article follow. Formats and hyperlinks were adapted from the original.
Detection of protium (H) and its heavier isotopes (deuterium (D) and tritium (T)) is required in biological analysis, (1−3) the nuclear industry, (4−7) and other isotopic applications (8−10) routinely. One of the essential reasons for isotopic detection in these areas is to ensure that the deuterium or tritium content in the required sample or solution is quantitatively under control. This is especially so not only for CANDU reactors, which build up T2O in the moderator (D2O) after a certain period of operation (11,12) but also for potential fusion fuel storage (D/T mixtures) and waste processing in fusion power plants. (13−16) This specific requirement of determining the relative abundance of mixed hydrogen isotopes can be achieved by infrared (IR) spectroscopy. Fourier transform infrared (FTIR) spectroscopy identifies the isotopic bonds based on the difference in adsorption wavelength of the vibrational motions. Assuming atoms in the molecules are under harmonic oscillation, the IR adsorption wavenumber of the congeneric chemical bond highly depends on the mass of the atoms comprising the bond, which leads to distinguishable responses between protium, deuterium, and tritium bonds in the compounds. (17−19) Profiting from that, IR spectroscopy has been applied for deuterium detection in aqueous solutions for decades, particularly for identifying D2O in H2O solutions. (20−23) Two different vibrations can be detected and used to determine the isotopic concentration by IR analysis for the H2O/D2O mixtures: asymmetric stretching of the O–H (3750 cm–1 – 2750 cm–1)/the O–D (2750 cm–1–2000 cm–1) and bending (scissoring) of the H–O–H (1850 cm–1–1500 cm–1)/D–O–D (1250 cm–1–1000 cm–1)/H–O–D (1500 cm–1–1250 cm–1). (19,24−26)
Recently, it was noted that using the only bending motion of the water molecules with sharper responses than that of the stretching motions can lead to more accurate results in determining H2O/D2O compositions as compared to using the stretching motions which sometimes can saturate beyond the maximum limit of detection. (27−30) However, research into quantitative analysis and simulation of the isotopic composition in H2O/D2O mixtures using bending motions in FTIR spectroscopy is still limited. Here, we introduce a rapid analytical method for identifying the isotopic composition of isotopically mixed water based on the measurement of the relative intensity of the bending peaks from the absorbance mode of FTIR spectroscopy. The intensities of the adsorption bands in the IR spectrum are determined by the absorbability of the bond, the pathway of IR, and the concentration of the bond in the tested sample. Absorbability is also known as the absolute measure of IR absorbance intensities of the band, while the maximum absorbability can be regarded as the concentration of the specific vibration in the sample. (31−34) By applying our method, we can simplify the operation and calculation process for determining the isotopic concentration in an H2O/D2O mixture, thereby offering a rapid means of measuring isotopic change after accounting for the equilibrium kinetics (23) of hydrogen bonds in the aqueous solution with better accuracy compared to peak-area. (19,26,28)
Here, we will demonstrate how data generated from FTIR spectroscopy show excellent agreement with theoretical calculations of isotopic concentrations in water mixtures under equilibrium conditions, proving that using the maximum intensity of the different bending vibrations can offer a reliable measurement for the isotopic concentration and sensitivity in detecting isotopic variation.
Experimental Methods
Fourier Transform Infrared Spectroscopy
The FTIR spectrometer used in the experiments was a mid-IR spectrometer (4000 cm–1–400 cm–1; Spectrum Two, PerkinElmer, USA). The molar absorptivity of H2O and D2O undergoing bending motion is 21.8 ± 0.3 M–1cm–1 and 17.4 ± 0.2 M–1 cm–1, respectively, in the mid-IR range at 25 °C, with an optical cell path length of around 3.6 μm for H2O and 4.5 μm for D2O. (35,36)
For each measurement, a background was taken and removed from the sample analysis; the same amount of 0.02 mL samples was dropped on the detection plate to ensure that the solution fully covered the sample detector with enough IR transmitted through the sample. Experiments were duplicated to ensure the accuracy. Each bond’s (like H–O–H, D–O–D, or H–O–D) bending motion offers an identical response in the same IR source, and the environment of the liquid can cause slight shifting in peak position but the influence of the existence of H–O–D on the intensity of H–O–H and D–O–D is regarded as identical since half of the molecule is from H2O and rest of them is from D2O.
Spectra were first analyzed using software provided by the FTIR spectrometer supplier (PerkinElmer Spectrum Two), but further data analysis was performed using Origin Lab software. The baselines for the spectra were corrected before normalization and the proportion in 100% D2O and 100% H2O (0% D2O) solution was considered to be 1 and 0, respectively, for subsequent calculations of isotope proportions. By taking pure H2O and pure D2O as the standard for 100% H2O and 0% H2O, we can convert the intensity of each H–O–H peak in the series into concentrations and enable comparison of the specific peak H–O–H between the spectra. The proportion calculation for measured HDO was based on the amounts of H2O and D2O generated from the bending motion of the FTIR spectrum.
Results and Discussion
Analysis of Hydrogen Isotope Mixtures in an Organic Environment
An investigation of the influence of the solvent environment on the FTIR signal response of hydrogen isotope mixtures was accomplished by adding an organic solvent without free hydrogen or hydroxide groups to the pure water mixture and collecting the equilibrium spectra of the solutions at room temperature. The particular solvent (CD3CN) was chosen as it is not considered to be able to react with either D2O or H2O and is stable at experimental temperatures. By adding the same amount of solvent into the different test solutions, the intensities of the solvent peaks could be controlled. As shown in Figure 4a, the isotopic hydrogen fractions calculated from the peak intensities of the bending vibration still offered high agreement with the theoretical curves. According to the recorded spectra (Figure 4b), the presence of the solvent did not cause an increase in the signal background, especially compared with H2O, which potentially reduced the deviation from the theoretical value. Moreover, the location of the vibration peaks from CD3CN was not in the measurement range of the bending motions of H2O or D2O, further reducing any error that adding the solvent may cause. This result suggests that the method can be applied for quantitative analysis of hydrogen isotope ratios in solvent/water mixtures if the solvent has FTIR-observable peak positions suitably distanced from the hydrogen bonds and is stable in aqueous environments.
 ACS Omega 2025, 10, 24, 25801–25809: Figure 4. (a) Equilibrium fraction of simulated and measured H2O and D2O. (b) FTIR absorbance of H2O/D2O mixtures with CDCN3 as a standard solvent in terms of the initial concentration of D2O at room temperature.
To reduce the potential influence caused by the infrared waves penetrating through the sample, ATR-FTIR (attenuated total reflectance-FTIR) (44) was also applied to the test mixture (Figure S5). However, the diamond detector, which is an intrinsic part of the instrument, reduced the signal-to-noise ratio significantly around 2000 cm–1 influencing the background reading in the spectra. Moreover, limited by the refractive index of the liquid sample, the IR cannot penetrate through the required volume of liquid D2O resulting in a misreading of intensities for the stretching peak. Thus, the research presented here has focused solely on standard FTIR analysis for all of the measurements, and we discount ATR-FTIR as being less efficient for the same measurements.
Sensitivity of FTIR Analysis for Hydrogen Isotope Verification
To determine the sensitivity and limitations of the FTIR technique in detecting proportional variations of H2O/D2O mixtures, measurement of five different D2O/H2O mixtures from 43.56%–45.71% D2O (with ∼0.5% isotopic increase per solution) was carried out at room temperature. For each mixture, measurements were made in triplicate to ensure accuracy of the generated spectra, as shown in Figure 5.
 ACS Omega 2025, 10, 24, 25801–25809: Figure 5. (a) FTIR spectra of 43%–45.71% D2O (43% in black, 43.56% in red, 44.12% in blue, 44.66% in green, 45.19% in purple, 45.71% in orange; * stands for the first duplication experiment in dash line, ** stands for the second duplication with dash-dot line). (b) Emphasized H2O peak (at around 1650 cm–1) of 43%–45.71% D2O. (c) Emphasized D2O peak (at around 1211 cm–1) of 43%–45.71% D2O.
The HDO peak shown at 1450 cm–1 was identical for all solutions from 43.56%–45.71% D2O, indicating that the bending motion for HDO was unsuitable for detecting small variations in hydrogen isotope ratios in the liquid mixture, as also proved in the former experiments (Figure 5a). Unlike the HDO bending vibration, the IR peaks associated with the bending motions of the H2O and D2O molecules resulted in a clear and measurable intensity difference with changes in the D2O concentration between samples (Figure 5b,c). Repeat measurements confirm the stability and reliability of using the intensity change in these vibrational peaks to represent the proportional (isotopic density) increase. Using the equilibrium fraction of the 43% D2O solution as a reference, equilibrium fractions of the 43.56%–45.71% D2O solutions can be calculated (Table 3) suggesting a good agreement among the measurements. For example, the average calculated equilibrium fractions of D2O and H2O for 43.56% D2O solution were 21.78 ± 0.01% and 33.35 ± 0.04%, respectively.
Conclusions
In conclusion, FTIR spectroscopy has been demonstrated as an effective technique for determining the ratios of hydrogen isotopes in water mixtures. FTIR results suggested a close agreement of measurements with theoretical analysis based on equilibrium kinetics. The method was proven reliable in estimating the isotopic ratio from 0 °C up to room temperature under different chemical environments with a relatively low standard deviation (average deviation ≤1%), suitable for industrial application. Benefiting from the sensitivity of the H2O and D2O bending response in FTIR spectroscopy, it is possible to detect small isotopic variations (0.5%) by converting the measured peak intensity change to the fractional ratio of the aqueous solution. This method offers a rapid and practicable way of detecting hydrogen isotopic variations in water mixtures that would be suitable for research and industrial applications that require in situ isotopic determination. For example, FTIR spectroscopy could be applied in situ to a water-based tritium scrubbing plant (i.e., CANDU) to help measure the accumulation rate of T2O in cascades of water bubblers.