ICP-MS triple quadrupole as analytical technique for the characterization of metal contamination processes in commercial flours for food safety

Journal of Food Composition and Analysis, Volume 141, May 2025, 107387: Fig. 1. Biplot obtained from PCA scores using XLSTAT software by Addinsoft. In black the active variables and with colored circles the samples: wheat flour in dark yellow, durum wheat in green, oats in blue, corn in yellow, spelt in red and rice in light blue.
This study examines the elemental composition of various commercial flours to detect contamination from soil pollution and milling processes. Using ICP-MS triple quadrupole in an ISO 6 cleanroom, toxic trace metals such as arsenic, cadmium, and lead were linked to soil contamination, while vanadium was identified as a key marker of process contamination due to its presence in milling equipment.
Additionally, caesium accumulation in the inner wheat grain was found to be a potential marker for type 00 wheat flour. The study highlights how poor maintenance, wear, or economic factors may contribute to contamination, providing insight into food safety risks associated with flour production.
The original article
ICP-MS triple quadrupole as analytical technique for the characterization of metal contamination processes in commercial flours for food safety
Chiara Telloli, Flavio Cicconi, Pasquale Lombardi, Fabio Borgognoni, Stefano Salvi, Maria Carmela Iapalucci, Antonietta Rizzo
Journal of Food Composition and Analysis, Volume 141, May 2025, 107387
https://doi.org/10.1016/j.jfca.2025.107387
licensed under CC-BY 4.0
Selected sections from the article follow. Formats and hyperlinks were adapted from the original.
1. Introduction
The present work is focused on the research of the metal contaminants, such as As, Cd and Pb present in flours that are controlled by the European Community regulation, but also on different much less investigated elements like V, Co, Cr and Ni trying to identify possible markers for the contaminations deriving from the production process. In this regard, the quantification of V content is an extremely useful indicator for potential industrial process contamination as it is commonly not found in the soil, but it is very common in the industrial alloys used in milling cylinders.
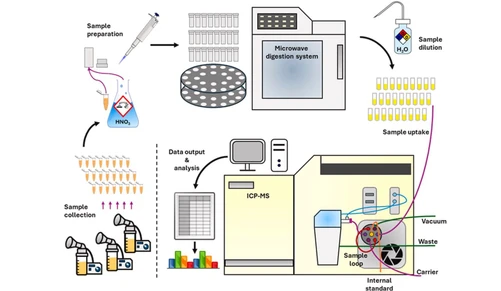
Flour samples were analysed with a triple quadrupole mass spectrometer (ICP-MS QQQ) in ISO 6 cleanroom to reduce the presence of external contamination.
In particular, the elements arsenic, cadmium, and lead were analysed as markers of soil contamination and because they are dangerous for human health.
2. Experimental
2.2 Laboratory facilities
For the characterization of toxic trace metals in commercial flours, a specific ICP-MS Facility was used. The high-level laboratory facility for trace element/isotopic analysis was located in ENEA C.R. Brasimone (Emilia Romagna region, Italy), which is composed by a Clean Laboratory for sample treatment and a Clean Room ISO 14644–1 with controlled parameters such as pressure, temperature, and humidity, satisfying all standard request for food trace analysis with a maximum concentration limits of 1 × 10⁶ (particles/m3) for particles ≥ 0.1 µm for ISO Class 6. (Telloli et al., 2023). The operation conditions of the Clean Room are controlled by a Programmable Logic Controller (PLC) located in the technical compartment that guarantee the maintenance of the parameter: air flow 9400 m3/h; humidity ≤ 50 % and temperature between 20.8 and 21.5 °C.
A triple quadrupole inductively coupled plasma mass spectrometer (ICP-MS-QQQ) 8800 model (Agilent Technologies, Santa Clara, CA, USA) was the analytical technique used in this experiment. The instrument is located in the clean room to guarantee the control quality which reduce the limit of detection of all the elements, reducing the presence of pollutants.
The Clean Laboratory was specifically designed for sample handling and preparation. Prior to ICP-MS-QQQ analysis, samples undergo microwave digestion to mineralize them. The Clean Laboratory is equipped with a system of absolute HEPA H14 filters, which effectively eliminates contaminants from the external environment. This ensures a suitable working space for trace analysis, in compliance with EN 1822:2009 standards. All sample preparation procedures were conducted within this controlled environment.
3. Results
3.2 Flour sample data analysis
Firstly, chemometric analysis was used to discriminate samples from different type of flours characterized by common features, and to gain a first understanding of the distribution of toxic trace metals in flours grouped into clusters.
For the PCA model, only the first two principal components (PCs) were selected explaining the 47.36 % of the variance (as shown in Table S4 and in the Scree plot in Fig. S3, both in Supplementary Materials).
Fig. 1 shows the biplot scores in which the samples are separated into different clusters, representing the different type of flours.
Journal of Food Composition and Analysis, Volume 141, May 2025, 107387: Fig. 1. Biplot obtained from PCA scores using XLSTAT software by Addinsoft. In black the active variables and with colored circles the samples: wheat flour in dark yellow, durum wheat in green, oats in blue, corn in yellow, spelt in red and rice in light blue.
Rice and spelt flour samples (coloured in light blue and red respectively) are clustered in the lower part of the graph in Fig. 1, represented by toxic metals as Pb, Cs and Tl.
On the opposite, on the top of the graph, there is the cluster of the oats flour samples (coloured in blue), represented by Zn and Sr toxic trace elements.
In the central part of the graph in Fig. 1 on the left, durum wheat flour samples (coloured in green) appear to be enriched in Se.
Wheat and corn flour samples are not clearly distinguishable. This occurs because in this samples we consider all the different kind of wheat samples (types 00, 0, 1, 2 and whole wheat) and the different grade of refining probably generate flours with different values of the elements analysed. However, there could be more evident differences of corn flour samples, which are represented by two cluster, one that appear to be enriched in Pb and the other less.
3.3. Aluminium, arsenic, cadmium and lead average concentration
Food safety is ensured when the concentrations of toxic trace metals in commercial flours are kept under control. The main indicators of metal pollutant in flours are related to the concentration of aluminium, arsenic, cadmium and lead.
Fig. 2 shows the average concentration, expressed in µg/kg, of aluminium (coloured in green), arsenic (coloured in orange), cadmium (coloured in blue) and lead (coloured in grey) for all the samples analysed in this scientific work. The wheat samples 00, 0, 1, 2 and wholewheat are represented by the column named wheat, because they are all Triticum aestivum.
 Journal of Food Composition and Analysis, Volume 141, May 2025, 107387: Fig. 2. Average concentrations of contaminants detected in the flours of the various cereals analysed and expressed in µg/kg: Al (green line), As (orange bar), Cd (blue bar) and Pb (grey bar).
The green line in Fig. 2 represents the average value of the aluminium which is much higher respect to the other three contaminants analysed (bar scale in green on the right side of the graph). Comparing the green line and the bars, the aluminium shows different trend respect to the other elements. The highest value is in oats, followed by wheat, durum wheat, corn and less in spelt and finally in rice, with a difference between the two extreme values of 2579 µg/kg (in oats flour) and 121 µg/kg (in rice flour). The aluminium value on wheat is similar to those compared by Ertl and Goessler (2018) but less than that published by Vrček and Vinković (2012).
Fig. 2 shows, also, that lead is a high abundant contaminant in all the different type of samples, with the highest average value for spelt, follow by corn, durum wheat and wheat 00. The lowest value for rice, oats, wholewheat and wheat 0 and 1.
The high value of lead in all the flour samples is not surprising because, despite being much less bioavailable than cadmium, in Italian agricultural soils its average concentration is higher than that of cadmium (Abollino et al., 2002; Buccolieri et al., 2010).
Wheat and durum wheat have similar trend for the three contaminants, with Pb which shows the higher values (2.650 and 4.637 µg/kg respectively) than the two other contaminants, then As (2.056 and 1.805 µg/kg respectively) and finally Cd, which instead shows lower values (0.567 and 0.710 µg/kg respectively). The Pb value of wheat is similar to that proposed by Nardi et al. (2009), but low respect to Vrček and Vrček (2012). Cd in wheat and durum what is present with low values in all the samples, compared to data in literature (Nardi et al., 2009; Vrček and Vinković, 2012) and respect the other two contaminants, as being uniformly distributed in the cereal it has a relatively low removal rate (10 %) compared to other metals (i.e., Pb around 60 %). The removal rate represents the decrease in the metal content in the flour compared to the cereal after cleaning, sieving, and milling. The average metal content is then lowered during processing, by removing the external parts of the grain (Cubadda et al., 2005). Finally, the value of As of the samples analysed show lower value than literature data, as for example by Nardi et al. (2009) and Thosago et al. (2022).
Oats flour shows similar value of wheat flour samples: Pb 2.261 µg/kg, As 1.124 µg/kg and Cd 0.540 µg/kg, which are higher respect to those found in rice except for As (1.652 µg/kg). The Pb value in rice is lower respect to that presented by Stakheev and Stolboushkina (2022). Also, for oats and rice, Cd is the lowest contaminant which shows very low value, also compared to data in literature (Li et al., 2022, Stakheev and Stolboushkina, 2022, Rubio et al., 2023).
Corn flour is not much studied but comparing the literature data with those obtained by ICP-MS-QQQ, the values are lower, for example for Cd and Pb compared to Hatami et al. (2022) and Rubio et al. (2023). Also, the value of As are lower respect to literature data (Supadmi et al., 2023).
Finally, also for spelt flours there are not a lot of publication regarding multielement analysis. Despite this, the As data obtained by ICP-MS-QQQ are low respect to that published from 1.57 µg/kg (our data) to 1.67 mg/kg (Wiwart et al., 2016) but probably for spelt the difference in the type of Triticum makes different data. The same is for Cd, 0.093 µg/kg (our data) compared to 1.54 mg/kg by Wiwart et al. (2016); and for Pb 7.317 (our data) and 1.12 mg/kg by Wiwart et al. (2016). Same comparison for other literature data (Slepecka et al., 2016).
5. Conclusions
Flours are the basis of any human diet, and often require pre-treatment before being consumed. Cereals grinding processes could create a potential risk of invisible contamination that could escape normal quality control analyses. The reasons can be the most disparate, from purely technical and economic ones (a good quality cylinder in AISI 304 steel has very high prices, in addition to the lost income due to the necessary downtime of machines for replacement), to those due to a search for a virtually absent contamination and much rarer than that due to Pb or Cd.
Commercial flours are generally produced through industrial process that involves the use of metal rollers. This research work shows how much these metals could accumulate in flours during the flour milling process, even if of small quantities.
Vanadium has been identified as a relevant element that can be monitored to unveil the tribocorrosion and milling process contamination as it is unequivocally transferred by the industrial alloys.
A solution to avoid or minimize the chromium, cobalt, nickel, and vanadium content on the flours could be the tempestive replacement of metal rolls and by increasing the process maintenance. Furthermore, these elements should be regularly checked by the competent authorities.